About This Site
Software development stuff
Archive
- 2017
- 2016
- 2015
- 2014
- 2013
- 2012
- 2011
- 2010
- 2009
- 2008
- 2007
|
Entries tagged "monitoring".
Sun, 15 Nov 2009 00:01:35 +0000
Graphs
Today I'd like to share some observations on web applications speed. My monitoring network checks almost one thousand of URL addresses and few interesting pictures are created here.
Lets see sample monitoring results from random URL (one week measurment): http://forum.magicsquad.eu (located currently in webh.pl hosting provider):
 As you can see typical site response time is almost four seconds! (DNS resolution time excluded) Measurment is performed from Cracow, Poland. Let's see results from Chicago, USA: As you can see typical site response time is almost four seconds! (DNS resolution time excluded) Measurment is performed from Cracow, Poland. Let's see results from Chicago, USA:
 Similar picture (slightly slower ping times visible). We have two possibilities here: Similar picture (slightly slower ping times visible). We have two possibilities here:
- Script is clumsy (PHPBB)
- Hosting is overloaded / improperly configured
Long term analysis
Let's see statistics generated by site-uptime.net (monitoring station in Poland):
 As you can see performance degradation (80% -> 10% responses under one second) started 5 months ago!. No one noticed that average page loading drops suddenly (no change of hosting provider since then!). As you can see performance degradation (80% -> 10% responses under one second) started 5 months ago!. No one noticed that average page loading drops suddenly (no change of hosting provider since then!).
You can reach current public report for monitored station here.
Conclusions
- I suggest to monitor site performance and availability, especially if you are making money from them
- Sometimes fix is at your fingertips (if you know the problem details)
Tue, 26 Jan 2010 20:54:38 +0000
Pytanie nie jest wbrew pozorom takie głupie jak się może wydawać. Serwisy WWW działają w trybie 24/7, dzięki czemu my (jako odbiorcy usług) nie musimy dopasowywać się do narzuconego z góry harmonogramu dostępności usługi (jak np. w urzędach). Ograniczenia dostępności usług wynikają z ograniczeń podsystemów je realizujących. W przypadku urzędu jest to człowiek, którego praca jest regulowana przez kodeks pracy i wewnętrzny regulamin. W przypadku usługi WWW ograniczeniem są niezbędne operacje administracyjne jak np. backup bazy danych.
Obserwując statystyki działania usług WWW można zaobserwować pewne schematy zachowania czasu odpowiedzi systemu które mogą wynikać z:
- aktualnej liczby użytkowników serwisu (która się zmienia w ciągu doby)
- chwilowego obciążenia maszyn realizującej usługę (skorelowane z liczbą użytkowników)
- czynników leżących poza serwerem jak np. obciążenie sieci
- regularnych automatycznych operacji administracyjnych (tzw. okno serwisowe)
Wykres pomiaru czasu odpowiedzi strony http://onet.pl za 8 dni wskazuje na ten ostatni czynnik:

Podpowiedź do pytania z tematu postu podkreśliłem na czerwono. Onet.pl wykonuje automatycznie jakiś proces który pomiędzy 5:00 a 5:15 odłącza mechanizm generujący stronę WWW. 15 minut to czas kiedy serwis może sobie raz na dobę "odpocząć". Kondycja godna pozazdroszczenia :-)
site-uptime.net jest usługą która pozwala ocenić jakość działania serwera na podstawie regularnych pomiarów czasu odpowiedzi HTTP. Problemy mogą być raportowane na wskazany adres e-mail lub SMS-em. Pozwala to na szybką reakcję w przypadku kiedy występuje problem i ocenę wydajności infrastruktury na podstawie danych historycznych.
Sat, 30 Jan 2010 17:06:08 +0000
It's very important to know about server problems before they have impart on overall system performance and stability. Typical problem with server that may occur:
- missing disk space
- high server load (caused by CPU/IO)
In past I had problems with web applications failing to operate because lack of free disk space used for session storage. From this time I used to install monitoring on every resource that may be a problem for system.
The easiest way (Keep It Simple Stupid) to be monitored is to redirect email from root@localhost and install checks on root's crontab. Output written to stdout/stderr (if present) is send to crontab owner after script execution. Our srcipts will only generate output when problem is found. For example:
Notify high (>4) load on server:
*/5 * * * * cat /proc/loadavg | awk '$2 > 4 { print "High 5-minute load", $2 }'
Notify when used disk space is above 90%:
00 21 * * * df | awk '/^\// && $5 > 90 { print $0 }'
Many additional checks could be configured that way.
In addition I used to install munin. It produces graphs that shows various resources levels (day, week, month and year perspective). You can see in one place your overall system. It's sample graph showing month VPS instance load:

Do you have similar tools to monitor your server performance?
Sat, 06 Feb 2010 21:56:52 +0000
Twitter is a "free social networking and microblogging service that enables its users to send and read messages known as tweets". It's gaining popularity last months - userbase is growing rapidly. It's interesting to analyse Twitter's server infrastructure load by observing service response time over few days.

One week HTTP measurement
I'm using another service: site-uptime.net to record and analyse statistics from running Twitter website. Measurements are performed every 15 minutes using HEAD requests, total time of receiving response (excluding DNS resolution time) is collected. Here are the results showing data collected from eight days using station from Poland:

You can see time response spikes located every ~10 PM GMT +2. Are they related to server load or network? To check that we can see measurements retrieved using station from Chicago, USA:

The picture is quite different. Seems the traffic on network connection to Europe causes higher access time. Let's see if it has impact on speed of serving responses:


Not so bad. ~90% of requests are served under 1 second, it's very good result. Average response time is 650 ms, minimal: 370 ms . Note no downtimes in January - a good result.
Where's Twitter located?
Let's see where twitter.com web server is located:
$ mtr twitter.com
(...)
 6. te3-1.lonse1.London.opentransit.net        0.0%    27   48.2  48.8  47.8  49.8   0.5
 7. xe-3-1.r01.londen03.uk.bb.gin.ntt.net      0.0%    27   48.6  96.8  48.1 244.9  67.3
 8. ae-1.r22.londen03.uk.bb.gin.ntt.net        0.0%    27   50.3  50.9  48.9  72.3   4.6
 9. as-0.r20.nycmny01.us.bb.gin.ntt.net        0.0%    27  131.7 129.7 127.7 132.7   1.4
10. ae-0.r21.nycmny01.us.bb.gin.ntt.net        0.0%    27  124.1 125.3 122.6 136.4   2.8
11. as-0.r20.chcgil09.us.bb.gin.ntt.net        0.0%    27  141.4 146.0 139.8 172.6   9.1
12. ae-0.r21.chcgil09.us.bb.gin.ntt.net        0.0%    27  144.7 147.4 143.7 181.2   7.7
13. as-5.r20.snjsca04.us.bb.gin.ntt.net        0.0%    27  199.7 210.2 199.7 281.7  18.4
14. xe-1-1-0.r20.mlpsca01.us.bb.gin.ntt.net    0.0%    27  203.7 204.2 198.9 242.5   8.0
15. mg-1.c20.mlpsca01.us.da.verio.net          0.0%    26  200.1 200.2 195.2 207.2   2.5
16. 128.241.122.117                            0.0%    26  196.7 197.6 193.1 209.1   2.7
17. 168.143.162.5                              0.0%    26  201.7 226.6 196.2 278.5  28.2
18. 168.143.162.36                             0.0%    26  196.4 212.4 195.8 261.2  21.0
Far from Europe (200 ms). geoiptool service will show more details:
 Servers are located in Colorado. The best times I can get from USA is ~110 ms (tested from Newark). Seems Europe Twitter users are in worse position, but the kind of service (short messages, easily compressable text content) works fine with such packet delays. Servers are located in Colorado. The best times I can get from USA is ~110 ms (tested from Newark). Seems Europe Twitter users are in worse position, but the kind of service (short messages, easily compressable text content) works fine with such packet delays.
About Measurement Service
site-uptime.net allows you to measure any website and notify you on downtimes. You can check how your website is visible for customers 24/7 and are able to track any problems (even if they appear out of your local business hours).
Mon, 15 Feb 2010 22:48:35 +0000
I just got an email from my monitoring system:
Site: http://twitter.com is down ('502 Bad Gateway')
Looked at main Twitter page and saw this picture:

I checked that Twitter responds very slowly and randomly shows "over capacity" page. You can see details on site-uptime public report. Here's response graph from last days (measure interval 15 minutes, HEAD requests):

UPDATE (2010-04-15): after few weeks the situation is getting worse:

Mon, 29 Mar 2010 21:42:22 +0000
One of my customers had many problems with stability of his server. Service stopped under medium web traffic and the only resolution was server restart. I was asked for optimisation of core components (MySQL database / Apache2 web server) but the result was not very satisfactory. I managed to limit swapping by limitting web server concurrency but it was not real problem solution.
Finally I traced problem source to PHP application run on this server. Joomla (especially forum script) caused system to crawl. One process needed above 60 MB of RSS memory. Imagine system handling 20 concurrent requests. The problems became visible when database size exceeded 200 MB. Source code analysis located the problem: loading big recordsets (whole tables) into memory. One PHP process without memory limit might "swap out" whole server.
My customer decided to rewrite from scratch source code, you will find below results of this optimisation (mostly Munin graphs). New system was installed on 27th March.
Here's number of slow queries recorded by MySQL, you can see they almost disappeared:

And below MySQL queries, two red spikes are database upgrade during transition into new system. After new version installation SQL queries dropped few times:

And here's CPU usage, again: dropped below 20%:

Thanks to the optimisation system load is now under 1:

And network can handle more traffic when application is optimised (faster page generation and loading):

And finally: response time recorded from site-uptime.net service ("visible" by your browser) is almost flat line!
 Now systems performs very well. Now systems performs very well.
In this case big optimisation (rewrite from scratch) deliveded "big" results. The hardest part is always to guess what's the performance bottleneck before optimisation. Sometime it's IO, sometimes CPU (especially on virtual servers), sometimes application is badly written. Monitoring tools (like Munin or site-uptime.net) will help a lot in this task.
Now the system has a huge space to grow.
Thu, 20 May 2010 06:30:19 +0000
 Recently I observed that AdWords-generated traffic dissapeared from Analytics panel. I thought: WTH? Recently I observed that AdWords-generated traffic dissapeared from Analytics panel. I thought: WTH?
I checked the logs and saw that URL called by AdWords:
http://my-site.com/?gclid=342343445345....
Generated 403 (Forbidden) server response. That was caused by recent change in Lighttpd filtering rules. I was paying for AdWords traffic but customer hit 403 error page. Ops!
In order to easily spot such problems in future I created the following scanner to easily find all error server responses.
awk '$9>=400' /var/log/lighttpd/access.log | less
If you are boring of 404 errors you can filter them out as well (leaving only 403 / 500 errors for investigation):
awk '$9>=400 && $9 != 404' /var/log/lighttpd/access.log | less
I discovered that the following URLs were inaccessible:
- /robots.txt (exclusion rules for web crawlers)
- /favicon.ico (icon used by web browsers)
Next step could be automation of this check (cron job that will send an alert if errant responses count is higher than N). It's left as exercise for the reader.
Thu, 20 May 2010 20:47:22 +0000
Most of us are using Web2.0 sites but massive user base that logins every second is a big challenge to system performance. Let's see how engineers working for MySpace, Facebook and Twitter are doing their job.
Note: all uptime buttons and images below are generated in real-time, you can click on images / baners to see reports with details directly from site-uptime.net.
MySpace
[caption id="" align="aligncenter" width="418" caption="MySpace uptime"] [/caption] [/caption]

Facebook
[caption id="" align="aligncenter" width="418" caption="Facebook uptime"] [/caption] [/caption]

Twitter
[caption id="" align="aligncenter" width="418" caption="Twitter uptime"] [/caption] [/caption]

As you can see the "winner" in this category is: Twitter! ;-)
Site-uptime.net
site-uptime.net is a service that continuously monitors websites and allows to configure email / SMS notifications on downtime. May be helpful for professionals who care about accessibility and uptime of their services.
Fri, 16 Sep 2011 22:52:07 +0000
 Current project I'm working on benefits from automated test suite run on few Linux-based devices. Tests are running 24x7, but sometimes device hangs (reason is still under investigation) and SSH access is blocked then. Current project I'm working on benefits from automated test suite run on few Linux-based devices. Tests are running 24x7, but sometimes device hangs (reason is still under investigation) and SSH access is blocked then.
In order to track the problem I redirected syslog (busybox-based, BTW) via network and added local automatic monitoring service that will show me when a part of my test installation go down.
The script is really simple and uses GNOME notification tool called notify-send.
#!/bin/sh
if ! ping -q -c 1 google.com > /dev/null
then
    # no network present
    exit
fi
for machine
do
    F=/tmp/$machine
    F2=/tmp/$machine.previous

    if ssh $machine 'echo OK' >$F 2>&1
    then
        rm -f $F $F2
    else
        if test -f $F2
        then
            notify-send "$machine is not present: `cat $F`"
        fi
        mv $F $F2
    fi
done
Details:
- I'm checking if network is available in general (google ping)
- List of SSH machines given on command line
- I assume SSH keys are setup - no password prompt
- Check state is held in /tmp/ directory
Script is started periodically from crontab:
* 9-17 * * 1-5 srv-monitor-ssh alfa beta delta zeus zeus2
and reports failure on second failed check.
Wed, 21 Sep 2011 07:09:28 +0000
 The simplest way to monitor free disk space on Linux serwer, just place it in crontab: The simplest way to monitor free disk space on Linux serwer, just place it in crontab:
0 8 * * * df -h | awk '/^\// && $5 > 95 { print "missing space", $0 }'
and ensure e-mail to this user is forwarded to you then you will see e-mail when occupied space is higher than 95% on any disk.
Pretty simple.
Fri, 21 Oct 2011 22:37:32 +0000
Would you like how your web application performance behaves across longer time periods? Now it's possible with site-uptime.net! We've just added visualisation of statistics:
 Above sample is not bad system responded in <1s for >88%. It looks like no optimisations needed here. Let's see different case: Above sample is not bad system responded in <1s for >88%. It looks like no optimisations needed here. Let's see different case:

Ops! We had some performance problems 2010-03 .. 2010-07 (twitter.com, BTW). Looks like they were fixed in next months.
We are going to allow store and show day-by-day visualisations as well to give you feedback in shorter amount of time.
Sat, 11 Feb 2012 00:42:11 +0000
 Recently I was diagnosing problems with missing multicast data for some system. Multicast send UDP packets from single source to many registered subscribers. IPTV is using this feature to stream video for example. For unicast (1-1) transmissions you can use netcat or telnet but what tool can test multicast data? Recently I was diagnosing problems with missing multicast data for some system. Multicast send UDP packets from single source to many registered subscribers. IPTV is using this feature to stream video for example. For unicast (1-1) transmissions you can use netcat or telnet but what tool can test multicast data?
The answer was located pretty quickly: socat tool can register to multicast sources and pipe output to many destinations (stdout for example). Let's give a sample first:
socat UDP4-RECVFROM:9875,ip-add-membership=225.2.215.254:0.0.0.0,fork -\
 | grep -a '^s='
Values to change:
- 225.2.215.254: sample multicast IP address
- 9875: sample multicast port
- ^s=: string to be located in multicast data (in my case data protocol is textual)
Explanation:
- UDP4-RECVFROM: receive IPv4 UDP packets
- ip-add-membership: multicast requires registering of packets receiver
- 0.0.0.0: accept multicast on any client interface (you can specify here your client network address here as well)
- grep -a: sometimes you need just subset of incoming data, in my case textual data was mixed with binary (-a parameter for grep)
Wed, 22 May 2013 23:04:14 +0000
My current customer develops embedded devices used by many end users. In order to save server load devices use multicasts for downloading data: every device registers itself on multicast channel using IGMP and listens to UDP packets. No connections to be managed results in lower overhead.
However, some data (or some requests) cannot be downloaded from multicasts channels and HTTP/HTTPS must be used to interact with server. As the number of devices is very high special methods have been used in order not to overload backend servers (randomised delays, client software optimization).
Consequently, small bug in client software that will trigger more events than usual can be very dangerous to whole system stability (because the effect of thousands of devices - perfect DDOS may kill back-end). In order to catch such errant behaviour as soon as possible I've developed daily report that controls server usage in my customer office.
First of all, we need to locate the most "interesting" device by IP address from logs (we list top 20 IPs based on server usage):
    ssh $server "cat /path-to-logs/localhost_access_log.$date.log" | awk '
        {
            t[$1 " " $7]++
            ip[$1]++
        }
        END {
            for(a in t) { print t[a], a }
            max = 0
            max_ip = ""
            for(a in ip) { if(ip[a] > max) { max=ip[a]; max_ip=a; } }
            print max_ip > "/tmp/max_ip"
        }
    ' | sort -n | tail -20
    IP="`cat /tmp/max_ip`"
Then selected IP will be examined hour-by-hour to locate patterns in behavior:
ssh $server "cat /path-to-logs/localhost_access_log.$date.log" | awk -v "SEARCH=$IP" '
{ sub(/:[0-9][0-9]:[0-9][0-9]$/, "", $4); TIME=$4; s[TIME]; }
$0 ~ SEARCH { s[TIME]++;}
END { for(a in s) { print a, s[a] } }
' $* | sort
Sample results with included requested URLs:
Number of calls on 2013-05-22, server: tm2

3 192.168.4.101 /path/nPVR getseries
3 192.168.4.101 /path/reminder get
3 192.168.4.101 /path/rentedItems
3 192.168.4.101 /path/stbProperties get
3 192.168.4.101 /path/subscriberInfo
3 192.168.4.140 /path/autoConfig
6 192.168.4.249 /path/authenticate
6 192.168.4.249 /path/favorite get
6 192.168.4.249 /path/rentedItems
6 192.168.4.249 /path/stbProperties get
7 192.168.4.249 /path/reminder get
7 192.168.4.249 /path/subscriberInfo
8 192.168.4.140 /path/authenticate
8 192.168.4.249 /path/nPVR get
8 192.168.4.249 /path/nPVR getseries
16 192.168.4.254 /path/subscriberInfo
25 192.168.4.254 /path/nPVR get
25 192.168.4.254 /path/nPVR getseries
83 192.168.4.254 /path/favorite get
98 192.168.4.254 /path/reminder get

192.168.4.254 activity per hour:

[22/May/2013:00
[22/May/2013:01
[22/May/2013:02
[22/May/2013:03
[22/May/2013:04
[22/May/2013:05
[22/May/2013:06
[22/May/2013:07
[22/May/2013:08
[22/May/2013:09
[22/May/2013:10
[22/May/2013:11
[22/May/2013:12 8
[22/May/2013:13 4
[22/May/2013:14 16
[22/May/2013:15 18
[22/May/2013:16 12
[22/May/2013:17 50
[22/May/2013:18 24
[22/May/2013:19 24
[22/May/2013:20 24
[22/May/2013:21 24
[22/May/2013:22 24
[22/May/2013:23 22
We can see that 192.168.4.254 device started to spam server 24 times per hour from 18:00 until midnight (imagine thousands of devices that synchronously send requests to back-end the same way). This device logs will be thoroughly examined for possible reason for that behaviour.
At Aplikacja.info, we believe that software problems must be located as early as possible (even during development process). In above example we re-use existing development environment to catch problems that might be discovered in production with huge user base.
The general idea is to move detection and neutralisation of a problem into this direction:
1. end user -> 2. customer's QA -> 3. development company's QA -> 4. developer (runtime) -> 5. developer (build time)
The more distance from end user a bug is detected and fixed the better for us. I hope you would love to squash problems the same way.
Happy hunting!
Wed, 02 Oct 2013 22:26:48 +0000
Recently I've hit stability problem related to missing resources (leaking C++ programs). In order to track values of memory usage in a system dedicated probes have been written that collected many measurements every minute (with time included to correlate with environment events). Then we got the following data:
TIME playerd appman OneApplication datasync mmddf dtvservice pacman oci ondemandservice RCService pvrservice advertising localservices TOTAL
1002-1100 33128 12900 81484 16452 11164 15544 11020 21972 9976 9064 14948 11700 11588 260940
1002-1101 33160 12976 82088 17888 11228 15552 11024 21984 10368 9068 15632 11704 11608 264280
1002-1102 33172 12980 82100 17888 11720 15560 11024 21984 17604 9068 15780 11704 11608 272192
1002-1103 33172 12980 82100 34236 11804 15560 11024 21984 17608 9072 16200 11704 11608 289052
1002-1104 33172 12988 82108 44448 11860 15672 11024 21984 17608 9072 16764 11708 11864 300272
1002-1105 33172 12988 82112 44452 11860 15688 11024 23744 17608 9072 21584 11708 11864 306876
1002-1106 33172 12988 82252 32824 11860 15688 11024 22908 17608 9072 26876 11708 11864 299844
1002-1107 33176 12988 82252 32824 11860 15688 11024 22908 17608 9072 33020 11708 11864 305992
(...)
But such raw data is pretty hard to analyse. The first idea was to employ spreadsheet with it's plotting capabilities but it was very slow for huge amount of data (sometimes we review measurements from few days, samples every one minute). Then an answer comes to my mind: gnuplot.
Gnuplot is an open source tool to draw any data using simple commands. It's very fast and can work as a batch process.
The script:
#!/bin/sh
export LC_ALL="C"
csv=$1DIR=`dirname $0`
{
echo "set terminal x11 font \",10\""
awk -f $DIR/plot-csv.awk $csv
} | gnuplot --persist
is pretty simple. It parses first line of data file and creates commands for gnuplot interpreter. The awk script does all the dirty details:
#!/bin/awk

FNR==1 {
if ($1 == "TIME") {
    timeMode = 1
    startColumn = 2
    print "set xdata time"
    print "set timefmt \"%m%d-%H%M\""
}
else {
    timeMode = 0
    startColumn = 1
}

F2 = FILENAME
gsub(/\//, "-", F2)
printf("set key samplen 1; set key horizontal left bottom outside autotitle columnhead; plot \"%s\" ", FILENAME)
for(n=startColumn;n<=NF;n++) {     if(n>startColumn){
        printf("\"\" ")
    }
    if (timeMode) {
        printf("using 1:%d ", n);
    }
    else {
        printf("using :%d ", n);
    }

    if ($n ~ /USER|SYSTEM|IDLE/) {
        printf(" lw .2 ");
    }
    else {
        printf(" with lines ");
    }

    if(n<NF){
        printf(",")}
    }
    print ";";
}
Result: leak in one of the processes is clearly visible from picture:
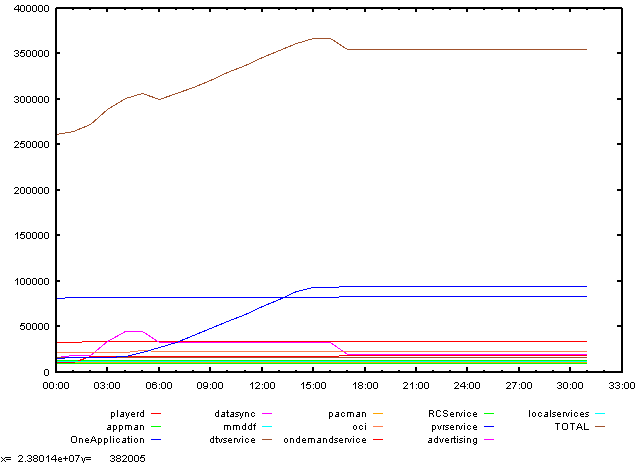
One picture instead of long data table will tell you much more on performance than numbers alone.
Sun, 13 Oct 2013 06:34:24 +0000
A new site has been just born: RandomTest.net. Based on my experiences gained from many projects I've created set of libraries for different environments that allows to:
- make random input to any application (web-based, smartphone, thick client-type, ...)
- collect errors found
- send them to central server
- prepare useful reports for stability analysis

The rationale:
Manual integration tests are expensive, unit developers tests are hard to implement properly and your latest click’n'play tool requires more and more maintenance effort for failing test cases along development?
What if we forget for a moment about scripting your UI by static scripts and replace it with totally random input? You will get for free coverage in almost whole application. “Wait” – you will say - “but there’s no way to check results as the input is random, is there?”.
Sure, here Design By Contract + Continuous Integration comes to play. You embed assertions in your system in many places. Failed assertions do not crash application, but are reported immediately to central server and aggregated into reports every day. Crashes, warnings, errors are reported, too. Then you can measure quality of your system-under-test by observing changes in number of errors, day by day. No scripting required to cover any new line of code! It will be tested automatically!
The source is open, the project is present on github.com.
Fri, 29 Nov 2013 14:10:30 +0000
Sometimes you need to quickly measure current bandwidth used by your Linux box and don't have dedicated command installed. You can use standard /proc/ file entries to get that info from the system.
Example of a embedded device with a TS stream as an input:
( cat /proc/net/dev; sleep 1; cat /proc/net/dev; ) | awk '/eth0/ { b=$1; sub(/eth0:/,"",b); if(bp){ print (b-bp)/1024/1024, "MB/s" }; bp=b }'
1.00053 MB/s
2015-07-23
Ttitle: Twitter.com performance analysis done over 5 years
A long time has passed since I've started to measure some of "mainstream" websites. One of them is twitter.com.
Probably you remember old days when everyone blamed it for general slowness and huge performance problems.
This is the past now! As you can see from the graph twitter.com staff did their homework quite well in 2013. Since then they respond almost instantly (~100% of requests under one second):
That's a great score!
A link to full measurement report is available there (measured by site-uptime.net).
Someone might ask: why do bother that ~50% of requests served under 2 seconds? I think you cannot just ignore such performance problems.
Even if you don't handle them with high priority you have to measure (to know if it's not going to be worse for example). The knowledge is crucial for making optimization decisions in the future.

|
Tags
|


