Recently I've hit stability problem related to missing resources (leaking C++ programs). In order to track values of memory usage in a system dedicated probes have been written that collected many measurements every minute (with time included to correlate with environment events). Then we got the following data:
TIME playerd appman OneApplication datasync mmddf dtvservice pacman oci ondemandservice RCService pvrservice advertising localservices TOTAL
1002-1100 33128 12900 81484 16452 11164 15544 11020 21972 9976 9064 14948 11700 11588 260940
1002-1101 33160 12976 82088 17888 11228 15552 11024 21984 10368 9068 15632 11704 11608 264280
1002-1102 33172 12980 82100 17888 11720 15560 11024 21984 17604 9068 15780 11704 11608 272192
1002-1103 33172 12980 82100 34236 11804 15560 11024 21984 17608 9072 16200 11704 11608 289052
1002-1104 33172 12988 82108 44448 11860 15672 11024 21984 17608 9072 16764 11708 11864 300272
1002-1105 33172 12988 82112 44452 11860 15688 11024 23744 17608 9072 21584 11708 11864 306876
1002-1106 33172 12988 82252 32824 11860 15688 11024 22908 17608 9072 26876 11708 11864 299844
1002-1107 33176 12988 82252 32824 11860 15688 11024 22908 17608 9072 33020 11708 11864 305992
(...)
But such raw data is pretty hard to analyse. The first idea was to employ spreadsheet with it's plotting capabilities but it was very slow for huge amount of data (sometimes we review measurements from few days, samples every one minute). Then an answer comes to my mind: gnuplot.
Gnuplot is an open source tool to draw any data using simple commands. It's very fast and can work as a batch process.
The script:
#!/bin/sh
export LC_ALL="C"
csv=$1DIR=`dirname $0`
{
echo "set terminal x11 font \",10\""
awk -f $DIR/plot-csv.awk $csv
} | gnuplot --persist
is pretty simple. It parses first line of data file and creates commands for gnuplot interpreter. The awk script does all the dirty details:
#!/bin/awk

FNR==1 {
if ($1 == "TIME") {
    timeMode = 1
    startColumn = 2
    print "set xdata time"
    print "set timefmt \"%m%d-%H%M\""
}
else {
    timeMode = 0
    startColumn = 1
}

F2 = FILENAME
gsub(/\//, "-", F2)
printf("set key samplen 1; set key horizontal left bottom outside autotitle columnhead; plot \"%s\" ", FILENAME)
for(n=startColumn;n<=NF;n++) {     if(n>startColumn){
        printf("\"\" ")
    }
    if (timeMode) {
        printf("using 1:%d ", n);
    }
    else {
        printf("using :%d ", n);
    }

    if ($n ~ /USER|SYSTEM|IDLE/) {
        printf(" lw .2 ");
    }
    else {
        printf(" with lines ");
    }

    if(n<NF){
        printf(",")}
    }
    print ";";
}
Result: leak in one of the processes is clearly visible from picture:
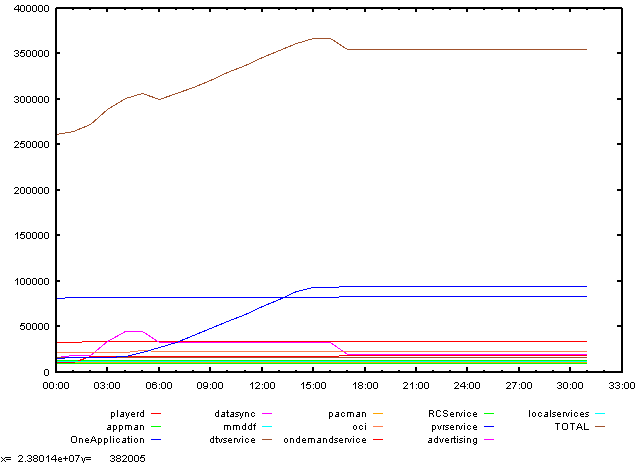
One picture instead of long data table will tell you much more on performance than numbers alone.