Uptime Statistics Visualisations For Site-uptime.net
Fri, 21 Oct 2011 22:37:32 +0000
Would you like how your web application performance behaves across longer time periods? Now it's possible with site-uptime.net! We've just added visualisation of statistics:
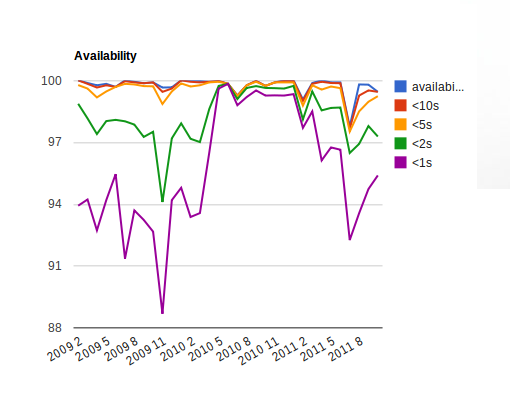
 Above sample is not bad system responded in <1s for >88%. It looks like no optimisations needed here. Let's see different case:
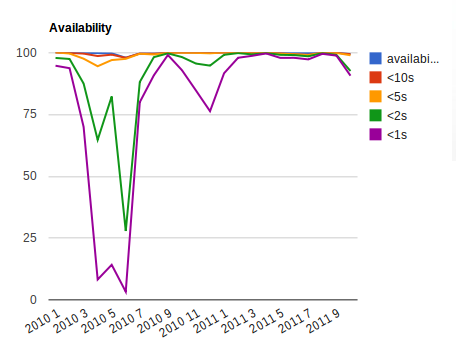
Ops! We had some performance problems 2010-03 .. 2010-07 (twitter.com, BTW). Looks like they were fixed in next months.
We are going to allow store and show day-by-day visualisations as well to give you feedback in shorter amount of time.
