About This Site
Software development stuff
Archive
- 2017
- 2016
- 2015
- 2014
- 2013
- 2012
- 2011
- 2010
- 2009
- 2008
- 2007
|
Entries tagged "c++".
Tue, 27 Jul 2010 18:17:19 +0000
Recently I've joined new project targetting STB (set top boxes). STB is a networking device (Ethernet based) that allows you to watch (record in some cases) HD films on your TV screen. I have no TV device in home (who cares TV if Internet is availabe?), but it's interesting to see the direction where current TV devices will go in near future.

Anyway, the most important difference to previous projects is "new" language: no more Java, no more Python, it's C++. You can find few C++ projects I published on SourceForge, but they're created >5 years old now, so I can use "new" word here ;-). The first thought of old Test Driven Design fan when creating development environment was: whre's JUnit for C++?
CppUnit
CppUnit is the most known port of Junit to C++ world. It's pretty mature, full-featured (am I hearing "fat"?) and ... verbose. See the code example:
// Simplest possible test with CppUnit
#include
class SimplestCase : public CPPUNIT_NS::TestFixture
{
    CPPUNIT_TEST_SUITE( SimplestCase );
    CPPUNIT_TEST( MyTest );
    CPPUNIT_TEST_SUITE_END();
protected:
    void MyTest();
};

CPPUNIT_TEST_SUITE_REGISTRATION( SimplestCase );

void SimplestCase::MyTest()
{
    float fnum = 2.00001f;
    CPPUNIT_ASSERT_DOUBLES_EQUAL( fnum, 2.0f, 0.0005 );
}
It's very verbose, indeed. Initially, I wanted to go in that direction but noticed much simpler syntax for declaring tests:
#include "lib/TestHarness.h"

TEST (Whatever,MyTest)
{
    float fnum = 2.00001f;
    CHECK_DOUBLES_EQUAL (fnum, 2.0f);
}
What was the library?
CppUnitLite
CppUnitLite was written by Michael Feathers, the original author of CppUnit, who decided to leave CppUnit and write something smaller / lighter (do you know this feeling ;-) ). That's why CppUnitLite was born.
CppUnit automatically discovers test cases based on TEST macro and organizes those tests into test suites. Small original code modications allows us to run:
- single test
- single test suite
- any combination of above
I see GoogleTest uses similar syntax for tests declarations. We will switch in the future if CppUnitLite features become too small for our requirements. At this very moment all needs are fulfilled:
- simple, easy to use syntax
- many assertions for comparing results
- light (important for embedded device)
Do you know of another C++ library that is worth considering?
Mon, 11 Oct 2010 21:43:10 +0000
 Good software developers are lazy persons. They know that any work that can be automated should be automated. They have tools and skills to find automated (or partially automated) solution for many boring tasks. As a bonus only the most interesting tasks (that involve high creativity) remain for them. Good software developers are lazy persons. They know that any work that can be automated should be automated. They have tools and skills to find automated (or partially automated) solution for many boring tasks. As a bonus only the most interesting tasks (that involve high creativity) remain for them.
I think I'm lazy ;-). I hope it's making my software development better because I like to hire computer for additional "things" apart from typewriter and build services. If you are reading this blog probably you are doing the same. Today I'd like to focus on C++ build process example.
The problem
If you're programmer with Java background C++ may looks a bit strange. Interfaces are prepared in textual "header" files that are included by client code and are processed together with client code by a compiler, .o files are generated. At second stage linker collects all object files (.o) and generates executable (in simplest scenario). If there are missing symbols in header file compiler raises an error, if symbol is missing on linking stage linker will complain.
On recent project my team was responsible for developing a C++ library (header and library files). This C++ library will be used then by another teams to deliver final product. Functionality was defined by header files. We started development using (automated by CPPUnitLite) unit tests then first delivery was released.
When other teams started to call our library we discovered that some method implementations were missing! It's possible to build a binary with some methods undefined in *.cpp files as long as you are not calling them. When you call that method from source code linker will find undefined symbol.
I raised that problem on our daily stand-up meeting and got the following suggestion: we have to compare symbols stored in library files (*.a, implementation) with method signatures from public *.h files (specification). Looks hard?
The solution
It's not very hard. First: collect all symbols from library files, strip method arguments for easier parsing:
nm -C ./path/*.a | awk '$2=="T" { sub(/\(.*/, "", $3); print $3; } '\
  | sort | uniq > $NMSYMS
Then: scan header files using some magic regular expressions and a bit of AWK programming language:
$1 == "class" {
   gsub(/:/, "", $2)
   CLASS=$2
}

/^ *}/ {
   CLASS = ""
}

/\/\*/,/\*\// {
   next
}

buffer {
   buffer = buffer " " $0
   if (/;/) {
     print_func(buffer)
     buffer = ""
   }
   next
}

function print_func(s) {

   if (s ~ /= *0 *;/) {
     # pure virtual function - skip
     return
   }
   if (s ~ /{ *}/) {
     # inline method - skip
     return
   }

   sub(/ *\(.*/, "", s);
   gsub(/\t/, "", s)
   gsub(/^ */, "", s);
   gsub(/ *[^ ][^ ]*  */, "", s);
   print CLASS "::" s
}

CLASS && /[a-zA-Z0-9] *\(/ && !/^ *\/\// && !/= *0/ && !/{$/ && !/\/\// {
   if (!/;/) {
     buffer = $0;
     next;
   }
   print_func($0)
}
Then make above script work:
awk -f scripts/scan-headers.awk api/headers/*.h | sort | uniq > $HSYMS
Now we have two files with sorted symbols that looks like those entries:
ClassName::methodName1
ClassName2::~ClassName2
Let's check if there are methods that are undefined:
diff $HSYMS $NMSYMS | grep '^<'
You will see all found cases. Voila!
Limitations
Of course, selected soultion has some limitations:
- header files are parsed by regexp, fancy syntax (preprocessor tricks) will make it unusable
- argument types (that count in method signature) are simply ignored
but having any results are better that have no analysis tool in place IMHO.
I found very interesting case by using this tool: an implementation for one method was defined in *.cpp file but resulting *.o file was merged into private *.a library. This way public *.a library has still this method missing! It's good to find such bug before customer do.
Conclusions
I spent over one hour on developing this micro tool, but saved many hours of manual analysis of source code and expected many bug reports (it's very easy to miss something when codebase is big).
Mon, 11 Oct 2010 22:14:25 +0000
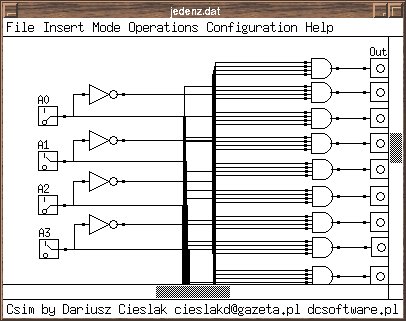
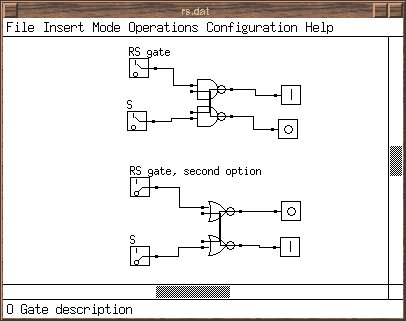
Recently I've found my old project that was prepared during studies at Warsaw University of Technology. It's called DCSim (Digital Circuit Simulator) and is written using C++ with old Athena widget library (does anyone remember libxt6.so?).

Software allows to define compound circuits and construct large networks from basic digital gates.
 Probably the code will not compile cleanly using current compiler set (I used GCC 2.7 then), I hope someone will clone this project and adapt for more current widget library (QT/GTK). Any volunteers :-) ? Probably the code will not compile cleanly using current compiler set (I used GCC 2.7 then), I hope someone will clone this project and adapt for more current widget library (QT/GTK). Any volunteers :-) ?
Sun, 19 Dec 2010 23:16:28 +0000
Java does it pretty well. C++ sucks by default. What is that?: The answer: Backtraces.
Sometimes assert information (file name and line number where assertion occured is not enough to guess where the problem is. It's useful to see the backtrace (stack trace in Java vocabulary) of calling methods/functions. You can achieve that in C++ using gdb (and analysing generated core files or run the program under debugger), but it's not a "light" (and elegant) solution (especially for embedded systems).

I'm presenting here a method to collect as meaningful backtraces in C++ as possible. Just link to module below and you will see pretty backtraces on abort/assert/uncaught throw/...
Let's first, install some handlers to connect to interesting events in program:
static int install_handler() {
    struct sigaction sigact;

    sigact.sa_flags = SA_SIGINFO | SA_ONSTACK;

    sigact.sa_sigaction = segv_handler;
    if (sigaction(SIGSEGV, &sigact, (struct sigaction *)NULL) != 0) {
        fprintf(stderr, "error setting signal handler for %d (%s)\n",
        SIGSEGV, strsignal(SIGSEGV));
    }

    sigact.sa_sigaction = abrt_handler;
    if (sigaction(SIGABRT, &sigact, (struct sigaction *)NULL) != 0) {
        fprintf(stderr, "error setting signal handler for %d (%s)\n",
        SIGABRT, strsignal(SIGABRT));
    }

    std::set_terminate(terminate_handler);
    std::set_unexpected(unexpected_handler);

    qInstallMsgHandler(qt_message_handler);

    return 0;
}

static int x = install_handler();
Some notes:
- qInstallHandler: some QT-related exceptions were not properly reported as backtrace, used for Q_ASSERT
- set_terminate, set_unexpected: C++ standard of "catching" uncaught exceptions
- sigaction: catch assert() macro call
Then define the handlers itself:
static void segv_handler(int, siginfo_t*, void*) {
    print_stacktrace("segv_handler");
    exit(1);
}

static void abrt_handler(int, siginfo_t*, void*) {
    print_stacktrace("abrt_handler");
    exit(1);
}

static void terminate_handler() {
    print_stacktrace("terminate_handler");
}

static void unexpected_handler() {
    print_stacktrace("unexpected_handler");
}

static void qt_message_handler(QtMsgType type, const char *msg) {
    fprintf(stderr, "%s\n", msg);
    switch (type) {
    case QtDebugMsg:
    case QtWarningMsg:
        break;
    case QtCriticalMsg:
    case QtFatalMsg:
        print_stacktrace("qt_message_handler");
    }
}
And finally define function that renders stacktrace to file handle passed:
/** Print a demangled stack backtrace of the caller function to FILE* out. */
static void print_stacktrace(const char* source, FILE *out = stderr, unsigned int max_frames = 63)
{
    char linkname[512]; /* /proc/
/exe */
    char buf[512];
    pid_t pid;
    int ret;

    /* Get our PID and build the name of the link in /proc */
    pid = getpid();

    snprintf(linkname, sizeof(linkname), "/proc/%i/exe", pid);

    /* Now read the symbolic link */
    ret = readlink(linkname, buf, 512);
    buf[ret] = 0;

    fprintf(out, "stack trace (%s) for process %s (PID:%d):\n",
        source, buf, pid);

    // storage array for stack trace address data
    void* addrlist[max_frames+1];

    // retrieve current stack addresses
    int addrlen = backtrace(addrlist, sizeof(addrlist) / sizeof(void*));

    if (addrlen == 0) {
        fprintf(out, "  \n");
        return;
    }

    // resolve addresses into strings containing "filename(function+address)",
    // this array must be free()-ed
    char** symbollist = backtrace_symbols(addrlist, addrlen);

    // allocate string which will be filled with the demangled function name
    size_t funcnamesize = 256;
    char* funcname = (char*)malloc(funcnamesize);

    // iterate over the returned symbol lines. skip first two,
    // (addresses of this function and handler)
    for (int i = 2; i < addrlen; i++)
    {
    char *begin_name = 0, *begin_offset = 0, *end_offset = 0;

    // find parentheses and +address offset surrounding the mangled name:
    // ./module(function+0x15c) [0x8048a6d]
    for (char *p = symbollist[i]; *p; ++p)
    {
        if (*p == '(')
        begin_name = p;
        else if (*p == '+')
        begin_offset = p;
        else if (*p == ')' && begin_offset) {
        end_offset = p;
        break;
        }
    }

    if (begin_name && begin_offset && end_offset
        && begin_name < begin_offset)
    {
        *begin_name++ = '\0';
        *begin_offset++ = '\0';
        *end_offset = '\0';

        // mangled name is now in [begin_name, begin_offset) and caller
        // offset in [begin_offset, end_offset). now apply
        // __cxa_demangle():

        int status;
        char* ret = abi::__cxa_demangle(begin_name,
                        funcname, &funcnamesize, &status);
        if (status == 0) {
        funcname = ret; // use possibly realloc()-ed string
        fprintf(out, "  (PID:%d) %s : %s+%s\n",
            pid, symbollist[i], funcname, begin_offset);
        }
        else {
        // demangling failed. Output function name as a C function with
        // no arguments.
        fprintf(out, "  (PID:%d) %s : %s()+%s\n",
            pid, symbollist[i], begin_name, begin_offset);
        }
    }
    else
    {
        // couldn't parse the line? print the whole line.
        fprintf(out, "  (PID:%d) %s: ??\n", pid, symbollist[i]);
    }
    }

    free(funcname);
    free(symbollist);

    fprintf(out, "stack trace END (PID:%d)\n", pid);
}
And finally: some includes to be able to compile the module:
#include <cxxabi.h>
#include <execinfo.h>
#include <execinfo.h>
#include <signal.h>
#include <stdio.h>
#include <stdio.h>
#include <stdlib.h>
#include <stdlib.h>
#include <string.h>
#include <ucontext.h>
#include <unistd.h>
#include <Qt/qapplication.h>
Note that you have to pass some flags during compiling / linking phase in order to have dynamic backtraces available:
-funwind-tables for compiler
- -rdynamic for linker
Tue, 15 Feb 2011 23:47:23 +0000
If you are hitting some performance problems (related to CPU) there is very powerfull tool that can help you with diagnostics: oprofile. Below I'm summarizing some hints for efficient oprofile usage (not all are very obvious). First of all: some basic commands:
- opcontrol: starts/stops statistics collection
- opreport: reporting tool

For applications that use shared libraries you have to add "--separate=lib" switch to opcontrol call:
opcontrol --start --separate=lib --vmlinux /boot/vmlinux
opcontrol --stop
Without this option you will see only main binary activities (without time spent in shared libraries).
Looking at raw opreports is not very useful. Sometimes "light" method will call another "heavy" method and you won't be able to locate the caller from report (very lov CPU usage). But sometimes caller should be located and modified to fix the performance problem. That's why "call graphs" were added for oprofile. In order to report using current stack contents you have to initialize oprofile properly:
opcontrol --start --callgraph=10 --vmlinux /boot/vmlinux
opcontrol --stop
Then besides raw data you can see code locations found on stack (callers and code called from function that eats most CPU):
  9        16.0714  libCommonWidgets.so.1.0.0 widgets::ActionItemWidget::isFocused() const
  11       19.6429  CoreApplication          _fini
  24       42.8571  libCommonWidgets.so.1.0.0 QPainter::drawPixmap(int, int, QPixmap const&)
4413     13.6452 libQtGuiE.so.4.7.1       /usr/lib/libQtGuiE.so.4.7.1
  4413     100.000 libQtGuiE.so.4.7.1       /usr/lib/libQtGuiE.so.4.7.1 [self]
As you can see there's one non-indented line. This is our CPU-heavy method. We also see callers (with percentage assigned - oprofile is a statistic profiler). We can guess probably drawPixmap() should be optimised here.
If you are tracking embedded systems you can perform reporting on host machine. Architecture can be totally different, but oprofile versions must match (there might be differences in internal oprofile format). I'm running reports by the following command:
opreport --image-path=/usr/local/sh4/some-arch/rootfs \
    --session-dir=/usr/local/sh4/some-arch/rootfs/var/lib/oprofile
As you can see you have to point to binaries location and /var/lib/oprofile (both are on rootfs mounted by NFS in my case). Using host for reports is much faster (and you have no problems with limited embedded device memory).
Mon, 21 Mar 2011 23:30:08 +0000
C++ compiler is pretty big and slow tool and if one needs to make full rebuilds very often waiting for build finish is very frustrating. For those guys "ccache" tool was created.
How is it working? Compiler output (*.o files) are cached under key that is computed from preprocessed source code, compiler versions, build switches. This way builds might be much faster.
Qmake is a Makefile generator that comes with QT and allows for easy build of QT-based (and other) projects. In order to join ccache and qmake one have to update so called "mkspecs" files. How to do that?
It's easy using sed (I'm including only sh4 and mipsel crosscompiler toolchains):
# sed -i '/QMAKE_CXX .*= *[^c][^c]/s/= /= ccache /' \
`find /usr/local -name qmake.conf | grep 'linux-\(sh4\|mipsel\)'`
And how to revert:
# sed -i '/ccache/s/ccache / /' \
`find /usr/local -name qmake.conf | grep 'linux-\(sh4\|mipsel\)'`
Of course you can manually launch an editor and update those files, but a bit of sed scripting is many times faster ;-)
Thu, 21 Jul 2011 21:24:11 +0000
 Dereferencing NULL pointer is a very common programming error in almost any programming language that supports pointers. It cannot be caught at build time in general, so we can carefully check every pointer before dereference and handle errant cases in runtime (warning in log?). Dereferencing NULL pointer is a very common programming error in almost any programming language that supports pointers. It cannot be caught at build time in general, so we can carefully check every pointer before dereference and handle errant cases in runtime (warning in log?).
But above method is a runtime method. If you don't have proper code coverage by tests it might not detect errant cases. I believe the answer for this issue lies in static methods (performed at build/before runtime phase). Good example of such approach is LCLint:
char firstChar2 (/*@null@*/ char *s)
{
   if (isNull (s)) return '\0';
   return *s;
}
As you can see LCLint uses annotations to mark parameter that might have NULL value and thus can detect dereferencing NULL. But LCList is only designed for C language and cannot check C++ (C++ is more complicated for parsing).
QT framework introduces smart pointer with reference counter-based garbage collection: QSharedPointer. This smart pointer allows for NULL value, can we make extension that will not accept NULL? Let's see:
template  class QNullableSharedPointer : public QSharedPointer {
public:
    QNullableSharedPointer();
    QNullableSharedPointer(QSharedPointer sp) { QSharedPointer::QSharedPointer(sp); }
    QNullableSharedPointer(T* ptr);
    QNotNullSharedPointer castToNotNull() {
        return QNotNullSharedPointer(*this);
    }
};

template  class QNotNullSharedPointer : public QNullableSharedPointer {
public:
    QNotNullSharedPointer(T* ptr);
protected:
    QNotNullSharedPointer();
    QNotNullSharedPointer(QNullableSharedPointer sp) { QNullableSharedPointer::QNullableSharedPointer(sp); }
    // T* operator-> () const;
    friend class QNullableSharedPointer;
};
As you can see I hide some methods in QSharedPointer subclass called QNullableSharedPointer. If you declare: "QNullableSharedPointer x" you cannot dereference "x->property" because x might hold a NULL value. In order to make dereference you have to cast to QNotNullSharedPointer: "x.castNotNull()".
Of course you can ask: "Hey, one can cast from nullable to null without any test for isNull()". That's correct. But casting can be easily scaned in source code and you can review those places carefully (or by some automated tool). It's only check that is left to human, rest will be handled by compiler (proper variant of pointer used).
As you probably noticed QNotNullSharedPointer might be called QSharedReferece instead to resemble fact that referecens in C++ should be always initialised. Yes, it's kind of "reference".
I haven't located any implementation of that pattern instead of this post ("Why no non-null smart pointers?" in context of Boost library). Do you know similar build-time techniques that can lower probability of programming error in C++ (thus increase of quality)?
Sat, 11 Feb 2012 01:07:39 +0000
 When you hit some level of code size in a project you starting to observe the following sequence: When you hit some level of code size in a project you starting to observe the following sequence:
- Developer creates and tests a feature
- Before submitting commit to repository update/fetch/sync is done
- Developer builds project again to check if build/basic functionality is not broken
- Smoke tests
- Submit
During step 3 you hear "damn slow rebuild!". One discovers that synchronization with repository forces him to rebuild 20% of files in a project (and it takes time when project is really huge). Why?
The answer here is: header dependencies. Some header files are included (directly and indirectly) in many source code files, that's rebuild of so many files is needed. You have the following options:
- Skip build dependencies and pray resulting build is stable / working at all
- Reduce header dependencies
I'll explain second option.
The first thing to do is to locate problematic headers. Here's a script that will find most problematic headers:
#!/bin/sh

awk -v F=$1 '
/^# *include/ {
    a=$0; sub(/[^<"]*[<"]/, "", a); sub(/[>"].*/, "", a); uses[a]++;
    f=FILENAME; sub(/.*\//, "", f); incl[a]=incl[a] f " ";
}

function compute_includes(f, located,
arr, n, i, sum) {
    # print "compute_includes(" f ")"
    if (f ~ /\.c/) {
        if (f in located) {
            return 0
        }
        else {
            located[f] = 1
            return 1
        }
    }
    if (!(f in incl)) {
        return 0
    }
    # print f "->" incl[f]
    n = split(incl[f], arr)
    sum = 0
    for (i=1; i<=n; i++) {
        if (f != arr[i]) {
            sum += compute_includes(arr[i], located)
        }
    }
    return sum
}

END {
    for (a in incl) {
        n = compute_includes(a, located)
        if (F) {
            if (F in located && a !~ /^Q/) {
                print n, a
            }
        }
        else {
            if (n && a !~ /^Q/) {
                print n, a
            }
        }
        for (b in located) {
            delete located[b]
        }
    };
}

' `find . -name \*.cpp -o -name \*.h -o -name \*.c` \
| sort -n
Sample output:
266 HiddenChannelsDefinitions.h
266 nmc-hal/hallogger.h
268 favoriteitemdefinitions.h
270 nmc-hal/playback.h
279 pvrsettingsitemdefinitions.h
279 subscriberinfoquerier.h
280 isubscriberinfoquerier.h
286 notset.h
292 asserts.h
As you can see there are header files that require ~300 source files to be rebuilt after change. You can start optimisations with those files.
If you locate headers to start with you can use the following techniques:
- Use forwad declaration (class XYZ;) instead of header inclusion (#include "XYZ.h") when possible
- Split large header files into smaller ones, rearrange includes
- Use PIMPL to split interfaces from implementations
Wed, 08 Aug 2012 09:52:34 +0000
Recently I've hit problem that some package was silently not installed in rootfs. The reason was visible only in debug mode:
$ bitbake -D
(...)
Collected errors:
 * opkg_install_cmd: Cannot install package libnexus.
 * opkg_install_cmd: Cannot install package libnexus-dbg.
 * resolve_conffiles: Existing conffile /home/sdk/master/wow.mach/tmp/rootfs/sdk-image/etc/default/dropbear
is different from the conffile in the new package. The new conffile will be placed
at /home/sdk/master/wow.mach/tmp/rootfs/sdk-image/etc/default/dropbear-opkg.
 * opkg_install_cmd: Cannot install package libpng.
 * opkg_install_cmd: Cannot install package libpng-dbg.
 * opkg_install_cmd: Cannot install package directfb.
 * opkg_install_cmd: Cannot install package directfb-dbg.
 * opkg_install_cmd: Cannot install package libuuid-dbg.
 * check_data_file_clashes: Package comp-hal wants to install file /home/sdk/master/wow.mach/tmp/rootfs/sdk-image/etc/hosts But that file is already provided by package * netbase-dcc
 * opkg_install_cmd: Cannot install package package1.
/etc/hosts file was clashes with one from netbase-dcc package. The solution was to re-arrange file list for comp-hal (not include /etc/hosts there):
FILES_${PN} = "\
               (...)
               /etc \
               /usr/local/lib/cecd/plugins/*.so* \
               /usr/local/lib/qtopia/plugins/*.so* \
               (...)
/etc specification was replaced by more detailed description:
FILES_${PN} = "\
               (...)
               /etc/init.d \ /etc/rc3.d \
               /usr/local/lib/cecd/plugins/*.so* \
               /usr/local/lib/qtopia/plugins/*.so* \
               (...)
Thu, 09 Aug 2012 12:14:08 +0000
OpenEmbedded is a framework for building (linux based) distributions. It's something like "Gentoo for embedded systems".
Ccache is a tool that allows to reuse building results thus gives big speed improvements for frequent rebuilds (>10x faster or more then full rebuild).
For the current project I was given responsiblity for existing build system reorganisation. We have many hardware targets and sometimes full rebuild of whole operating system can take many hours even on strong machine (16 cores in our case).
Of course you can reuse existing build artefacts (*.o files), but sometimes it can be dangerous (we cannot gurantee header dependencies are properly tracked between projects). Thus "whole rebuild" sometimes is necessary.
I need every build will be created using ccache: native (for x86) and for target platform (sh4, mipsel). Ccache allows "integration by symlink": you create symlink from /usr/bin/ccache to /usr/local/bin/cc and ccache will discover compiler binary on PATH (/usr/bin/cc) and call it if necessary (rebuild of given artifact is needed). I used that method of ccache integration.
On the other hand OpenEmbedded allows to insert arbitrary commands before every build using so called "bbclasses" and "*_prepend" methods. Below you will find integration methid applied to very basic OE base class: base.bbclass, thus ensuring every build will use ccache:
openembedded/classes/base.bbclass:

(...)
do_compile_prepend() {
    rm -rf ${WORKDIR}/bin
    ln -sf `which ccache` ${WORKDIR}/bin/`echo ${CC} | awk '{print $1}'`
    ln -sf `which ccache` ${WORKDIR}/bin/`echo ${CXX} | awk '{print $1}'`
    export PATH=${WORKDIR}/bin:$PATH

    export CCACHE_BASEDIR="`pwd`"
    export CCACHE_LOGFILE=/tmp/ccache.log
    export CCACHE_SLOPPINESS="file_macro,include_file_mtime,time_macros"
    export CCACHE_COMPILERCHECK="none"
}
As a result you will receive pretty good hit rate during frequent rebuilds:
$ ccache -s
cache directory                     /home/sdk/.ccache
cache hit (direct)                 50239
cache hit (preprocessed)              27
cache miss                           889
called for link                     3965
no input file                      33506
files in cache                    182673
cache size                           9.6 Gbytes
max cache size                      20.0 Gbytes
Fri, 19 Apr 2013 08:26:10 +0000
Openembedded is a tool to build Linux-based distribudions from source where you can customize almost every aspect of operating system and it's default components. Used mainly for embedded systems development. I'll show today how you can check easily (command-line, of course) dependencies chain.
Sometimes you want to see why particular package has been included into the image.
$ bitbake -g devel-image
NOTE: Handling BitBake files: \ (1205/1205) [100 %]
Parsing of 1205 .bb files complete (1130 cached, 75 parsed). 1548 targets, 13 skipped, 0 masked, 0 errors.
NOTE: Resolving any missing task queue dependencies
NOTE: preferred version 1.0.0a of openssl-native not available (for item openssl-native)
NOTE: Preparing runqueue
PN dependencies saved to 'pn-depends.dot'
Package dependencies saved to 'package-depends.dot'
Task dependencies saved to 'task-depends.dot'
By using:
grep package-name pn-depends.dot
you can track what is the dependency chain for particular package, for example, let's see what's the reason for inclusion of readline in resulting filesystem:
$ grep '>.*readline' pn-depends.dot
"gdb" -> "readline"
"python-native" -> "readline-native"
"sqlite3-native" -> "readline-native"
"sqlite3" -> "readline"
"readline" -> "readline" [style=dashed]
$ grep '>.*sqlite3' pn-depends.dot
"python-native" -> "sqlite3-native"
"qt4-embedded" -> "sqlite3"
"utc-devel-image" -> "sqlite3"
"sqlite3" -> "sqlite3" [style=dashed]
"devel-image" -> "sqlite3" [style=dashed]
"devel-image" -> "sqlite3-dbg" [style=dashed]
As we can see that it's the "devel-image" that requested "sqlite3" and then "readline" was incorporated as a dependency.
*.dot fomat can be visualised, but it's useles feature as the resulting graph may be too big to analyse.
Sat, 03 Jan 2015 17:58:13 +0000
 When you see the following kind of errors during cross compilation (linking phase): When you see the following kind of errors during cross compilation (linking phase):
ld: warning: libfontconfig.so.1, needed by .../libQtGui.so, not found (try using -rpath or -rpath-link)
ld: warning: libaudio.so.2, needed by .../libQtGui.so, not found (try using -rpath or -rpath-link)
There could be two reasons:
- the list of required binaries is not complete and linker cannot complete the linking automatically
- your $SYSROOT/usr/lib is not passed to linker by -rpath-link as mentioned in error message
During normal native build your libraries are stored in standard locations (/usr/lib) and locating libraries is easier. Cross compilation needs more attention in this ares as SYSROOT is not standard.
Then search for LDFLAGS setup in your build scripts:
LDFLAGS="-L${STAGING_LIBDIR}"
And change to the following:
LDFLAGS="-Wl,-rpath-link,${STAGING_LIBDIR}-L${STAGING_LIBDIR}"
The clumsy syntax -Wl,<options-with-comma-as-space> tells your compiler (that is used for linking purposes) to pass the options (with commas replaced by spaces of course) to linker (ld).
Sat, 16 Apr 2016 07:04:53 +0000
 Yocto is an Open Source project (based, in turn, on OpenEmbedded and bitbake) that allows you to create your own custom Linux distribution and build everything from sources (like Gentoo does). Yocto is an Open Source project (based, in turn, on OpenEmbedded and bitbake) that allows you to create your own custom Linux distribution and build everything from sources (like Gentoo does).
It's mostly used for embedded software development and has support from many hardware vendors. Having source build in place allows you to customize almost everything.
In recent years I was faced with problem of development integration - to allow distributed development teams to cooperate and to supply their updates effectively for central build system(s). The purpose of this process:
- to know if the build is successful after each delivery
- to have high resolution of builds (to allow regression tests)
- and (of course) to launch automated tests after each build
So we need some channel that would allow to effectively detect new software versions and trigger a build based on them. There are two general approaches for this problem:
- enable a "drop space" for files with source code and detect the newest one and use it for the build
- connect directly to development version control systems and detect changes there
1st method is easier to implement (no need to open any repository for access from vendor side). 2nd method, however, is more powerful as allows you to do "topic builds", based on "topic branches", so I'll focus on second approach there.
bitbake supports so called AUTOREV mechanism for that purpose.
SRCREV = "${AUTOREV}"
PV = "${SRCPV}"
If it's specified such way latest source revision in the repository is used. Revision number (or SHA) is used as a package version, so it's changed automatically each time new commit is present on given branch - that's the purpose we place ${SRCREV} inside PV (package version) veriable.
Having such construction in your source repository-based recipes allows you to compose builds from appropriate heads of selected branches.
Of course, on each release preparation, you need to fork each input repository and point to proper branches in your distro config file. Then the process should be safe from unexpected version changes and you can track any anomaly to single repository change (ask vendor to revert/fix it quickly if needed or stick to older version to avoid regression for a while).

|
Tags
|


