About This Site
Software development stuff
Archive
- 2017
- 2016
- 2015
- 2014
- 2013
- 2012
- 2011
- 2010
- 2009
- 2008
- 2007
|
Entries tagged "testing".
Sat, 22 Mar 2008 21:27:09 +0000
Zwykle testami jednostkowymi nazywa się wszystko co jest uruchamiane z poziomu JUnit. W większości przypadków nie są to testy jednostkowe, ale testy integracyjne, których utrzymanie i wytworzenie jest znacznie trudniejsze niż testów jednostkowych. Paul Wheaton wskazuje jakie korzyści osiągamy stosując rzeczywiste testy jednostkowe.
Paul proponuje następujące definicje w stosunku do pojęć związanych z testami:
- Test jednostkowy (Unit Test)
- Test nie mający kontaktu z bazą danych, serwerem aplikacyjnym, systemem plików, inną aplikacją, konsolą, mechanizmem logowania. Sprawdza zwykle jedną wybraną metodę izolując ją od innych obiektów poprzez obiekty Mock.
- Zbiór testów regresyjnych (Regression Suite)
- Kolekcja testów która może być uruchomiona " za jednym kliknięciem"
- Test Funkcjonalny (Functional Test)
- Sprawdza wiele metod / klas.
- Test Integracyjny (Integration Test)
- Sprawdza kilka komponentów współpracujących ze sobą.
- Test Komponentu (Component Test)
- Sprawdza działanie wybranego komponentu. Nie należy do zbioru testów regresyjnych.
- Akceptacyjny Test Komponentu (Component Acceptance Test)
- Formalny proces oceny pracy komponentu przez kilka osób.
- Test Systemowy (System Test)
- Wszystkie komponenty uruchomione razem.
- Systemowy Test Akceptacyjny (System Acceptance Test)
- Formalny proces oceny pracy systemu (wszystkie komponenty połączone razem) przez kilka osób.
- Test Obciążeniowy (Stress Test)
- Sprawdzenie działania komponentu(ów) uruchomionych pod zwiększonym obciążeniem.
- (Mock)
- Obiekt "udający" inny obiekt mający na celu odseparowanie obiektu podlegającego testom od innych obiektów.
- (Shunt)
- Podobny do obiektu Mock, ale nie izolujący w całości kodu od środowiska.
Problem zbyt wielu testów funkcjonalnych
Typowym objawem korzystania z testów funkcjonalnych zamiast testów jednostkowych jest liczba testów jakie zawodzą kiedy w kodzie pojawi się błąd:
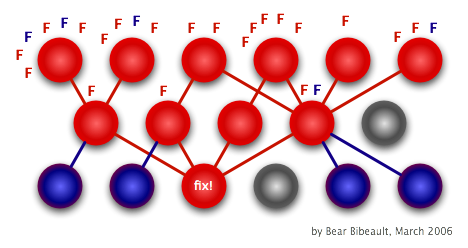
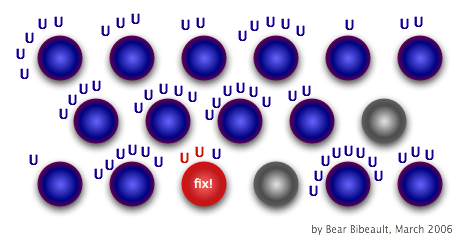
Przy prawidłowo utworzonych testach jednostkowych sytuacja będzie następująca:
Nieporozumienia na temat testów jednostkowych
- "Pisząc tylko testy jednostkowe piszą mniej kodu testowego, a sprawdzam więcej kodu produkcyjnego"
- Prawda, ale za cenę zwiększenia kruchości projektu. Także niektóre scenariusze są dużo trudniejsze do uruchomienia tylko w testach integracyjnych. Najlepsze pokrycie kodu można osiągnąć tylko poprzez odpowiednie połączenie testów jednostkowych z testami integracyjnymi.
- "Logika biznesowa opiera się na współpracujących klasach, więc testowanie klasy w odosobnieniu jest bezcelowe"
- Paul sugeruje testowanie wszystkich metod, ale oddzielnie. Zwraca uwagę, że testy integracyjne także mają swoją wartość.
- "Nie przeszkadza mi, że uruchomienie zestawu testów zajmuje kilka minut"
- Duży czas wykonania testów skłania do rzadszego uruchamiania testów i może z czasem prowadzić do zaprzestania uruchamiania testów (nikomu nie będzie sie chciało czekać na efekty).
- "Test jednostkowy to każdy test uruchomiony przez JUnit"
- Można uruchamiać testy integracyjne i systemowe korzystając z biblioteki JUnit.
Thu, 30 Jul 2009 22:48:54 +0000
W artykule Robert Mays opisuje swoje doświadczenia i sugestie związane z zapobieganiem defektom. Artykuł ukazał się w IBM Systems Journal w 1990 roku (niestety adres URL jest już nieaktualny).
Zapobieganie defektom składa się z czterech elementów włączonych w proces tworzenia oprogramowania:
- spotkania w trakcie których dokonywana jest szczegółowa analiza przyczyn (root cause) błędów i sugerowane są akcje prewencyjne
- wdrożenie akcji prewencyjnych w zespole
- spotkania przed pracą mające na celu zwrócenie uwagi programistów na sprawy jakości
- zbieranie i śledzenie danych
Autor wskazuje, że efektywniej jest zapobiegać pojawianiu się błędów niż je wyszukiwać (inspekcje, testowanie). Wtedy czas przeznaczany typowo na wyszukanie błędów można spożytkować w inny sposób (np. pracując nad kolejnym produktem).
Prewencja błędów opiera się na ciągłej analizie przyczyn błędów i usuwanie tych przyczyn poprzez poprawę procesu, metodyki pracy, technologii i narzędzi. Przy analizie przyczyn korzysta się z diagramów przyczynowo - skutkowych (czasami zwanych diagramami Ishikawy od nazwiska twórcy).
Proces ten zakłada włączenie różnych aktywności związanych z jakością do codziennej pracy zespołu.
Analiza wykrytych błędów
Podstawową aktywnością w projekcie jest spotkanie poświęcone analizie wykrytych błędów. Zespół próbuje znaleźć przyczyny (root cause) zaistniałych błędów i następnie proponuje wprowadzenie modyfikacji w procesie produkcyjnym, by zapobiec powstaniu takich błędów w porzyszłości. Dla każdego błędu stawiane są następujące pytania:
- Jaka jest kategoria tego błędu: komunikacja, przeoczenie, brak wiedzy, literówka?
- W jaki sposób błąd został wprowadzony?
- W której fazie tworzenia systemu powstał?
- W jaki sposób można zapobiec powstaniu takiego błędu w przyszłości? W jaki sposób podobne błędy mogą być usunięte z innych części systemu (o ile istnieją a nie zostały jeszcze wykryte przez inne techniki)?
Celem spotkania jest uzyskanie sugestii co do zapobiegania poszczególnym błędom. Nie powinno ono utknąć w zbyt szczegółowych rozważaniach (nie może być za długie). Przy końcu spotkania osoba prowadząca powinna zadać następujące pytania:
- Czy w analizowanych błędach widać trend, który może oznaczać szerszy problem?
- Co poszło dobrze podczas poprzedniej fazy? Co przyczyniło się do oszczędzenia czasu?
- Co poszło źle podczas poprzedniej fazy? Co stanowiło największy problem?
- Czy można w jakiś sposób poprawić techniki detekcji błędów, narzędzia, komunikację, edukację w stosunku do stanu aktualnego?
Obecność na takim spotkaniu programistów, którzy pracują nad systemem jest konieczna, ponieważ osoba, która wprowadziła błąd może najlepiej określić przyczynę wprowadzenia błędu.
Wprowadzenie korekt w procesie
Zespół wykonawczy (action team) odpowiada za wprowadzenie w życie akcji prewencyjnych zdefiniowanych w trakcie spotkania. Zespół ten typowo obsługuje wszystkie projekty prowadzone w ramach organizacji. Zwykle każdy członek zespołu odpowiada za jeden segment (definicja procesu, dokumentacja, narzędzia, edukowanie, projekt, programowanie, testowanie).
Oto możliwe rodzaje akcji zapobiegawczych:
- Zmiany w procesie produkcyjnym
- Utworzenie nowych narzędzi
- Szkolenie pracowników (seminaria, techniczne opisy niektórych aspektów produktu, artykuł na temat powtarzających się błędów)
- Zmiany w produkcie (systemie informatycznym), które ułatwiają wykrywanie błędów
- Usprawnienie komunikacji np. automatyczne powiadamianie o zmianach w projekcie dla wszystkich zainteresowanych osób
Mniejsza skala projektów
Opisane w artykule praktyki stosowane są w projektach dużej skali (kilkadziesiąt, kilkaset osób). Naturalnie pojawia się pytanie czy techniki zapobiegania defektom można stosować w projektach mniejszych (kilka, kilkanaście osób) lub w takich, gdzie struktura zespołu jest rozproszona (coraz częściej zdarza się, że zespół jest rozproszony geograficznie).
Według mnie jest to jak najbardziej możliwe. Oczywiście należy dopasować działanie do wielkości i charakteru zespołu:
- Analizę błędów można przeprowadzić przy użyciu kanału e-mail. Jest to mało absorbująca forma kontaktu (nie wymaga obecności w jednym czasie wszystkich członków zespołu)
- Rolę zespołu wykonawczego muszą przejąć członkowie zespołu wraz z automatycznym sprawdzaniem przyjetych reguł w kodzie (analizatory statyczne)
Uważam, że w każdej wielkości projektu korzyści wynikające z zapobiegania defektom są warte poświęconego czasu. Łatwiej jest problem usunąć raz niż wielokrotnie łatać powstałe w jego wyniku skutki na etapie testowania produktu.
Tue, 27 Jul 2010 18:17:19 +0000
Recently I've joined new project targetting STB (set top boxes). STB is a networking device (Ethernet based) that allows you to watch (record in some cases) HD films on your TV screen. I have no TV device in home (who cares TV if Internet is availabe?), but it's interesting to see the direction where current TV devices will go in near future.

Anyway, the most important difference to previous projects is "new" language: no more Java, no more Python, it's C++. You can find few C++ projects I published on SourceForge, but they're created >5 years old now, so I can use "new" word here ;-). The first thought of old Test Driven Design fan when creating development environment was: whre's JUnit for C++?
CppUnit
CppUnit is the most known port of Junit to C++ world. It's pretty mature, full-featured (am I hearing "fat"?) and ... verbose. See the code example:
// Simplest possible test with CppUnit
#include
class SimplestCase : public CPPUNIT_NS::TestFixture
{
    CPPUNIT_TEST_SUITE( SimplestCase );
    CPPUNIT_TEST( MyTest );
    CPPUNIT_TEST_SUITE_END();
protected:
    void MyTest();
};

CPPUNIT_TEST_SUITE_REGISTRATION( SimplestCase );

void SimplestCase::MyTest()
{
    float fnum = 2.00001f;
    CPPUNIT_ASSERT_DOUBLES_EQUAL( fnum, 2.0f, 0.0005 );
}
It's very verbose, indeed. Initially, I wanted to go in that direction but noticed much simpler syntax for declaring tests:
#include "lib/TestHarness.h"

TEST (Whatever,MyTest)
{
    float fnum = 2.00001f;
    CHECK_DOUBLES_EQUAL (fnum, 2.0f);
}
What was the library?
CppUnitLite
CppUnitLite was written by Michael Feathers, the original author of CppUnit, who decided to leave CppUnit and write something smaller / lighter (do you know this feeling ;-) ). That's why CppUnitLite was born.
CppUnit automatically discovers test cases based on TEST macro and organizes those tests into test suites. Small original code modications allows us to run:
- single test
- single test suite
- any combination of above
I see GoogleTest uses similar syntax for tests declarations. We will switch in the future if CppUnitLite features become too small for our requirements. At this very moment all needs are fulfilled:
- simple, easy to use syntax
- many assertions for comparing results
- light (important for embedded device)
Do you know of another C++ library that is worth considering?
Sun, 19 Dec 2010 23:16:28 +0000
Java does it pretty well. C++ sucks by default. What is that?: The answer: Backtraces.
Sometimes assert information (file name and line number where assertion occured is not enough to guess where the problem is. It's useful to see the backtrace (stack trace in Java vocabulary) of calling methods/functions. You can achieve that in C++ using gdb (and analysing generated core files or run the program under debugger), but it's not a "light" (and elegant) solution (especially for embedded systems).

I'm presenting here a method to collect as meaningful backtraces in C++ as possible. Just link to module below and you will see pretty backtraces on abort/assert/uncaught throw/...
Let's first, install some handlers to connect to interesting events in program:
static int install_handler() {
    struct sigaction sigact;

    sigact.sa_flags = SA_SIGINFO | SA_ONSTACK;

    sigact.sa_sigaction = segv_handler;
    if (sigaction(SIGSEGV, &sigact, (struct sigaction *)NULL) != 0) {
        fprintf(stderr, "error setting signal handler for %d (%s)\n",
        SIGSEGV, strsignal(SIGSEGV));
    }

    sigact.sa_sigaction = abrt_handler;
    if (sigaction(SIGABRT, &sigact, (struct sigaction *)NULL) != 0) {
        fprintf(stderr, "error setting signal handler for %d (%s)\n",
        SIGABRT, strsignal(SIGABRT));
    }

    std::set_terminate(terminate_handler);
    std::set_unexpected(unexpected_handler);

    qInstallMsgHandler(qt_message_handler);

    return 0;
}

static int x = install_handler();
Some notes:
- qInstallHandler: some QT-related exceptions were not properly reported as backtrace, used for Q_ASSERT
- set_terminate, set_unexpected: C++ standard of "catching" uncaught exceptions
- sigaction: catch assert() macro call
Then define the handlers itself:
static void segv_handler(int, siginfo_t*, void*) {
    print_stacktrace("segv_handler");
    exit(1);
}

static void abrt_handler(int, siginfo_t*, void*) {
    print_stacktrace("abrt_handler");
    exit(1);
}

static void terminate_handler() {
    print_stacktrace("terminate_handler");
}

static void unexpected_handler() {
    print_stacktrace("unexpected_handler");
}

static void qt_message_handler(QtMsgType type, const char *msg) {
    fprintf(stderr, "%s\n", msg);
    switch (type) {
    case QtDebugMsg:
    case QtWarningMsg:
        break;
    case QtCriticalMsg:
    case QtFatalMsg:
        print_stacktrace("qt_message_handler");
    }
}
And finally define function that renders stacktrace to file handle passed:
/** Print a demangled stack backtrace of the caller function to FILE* out. */
static void print_stacktrace(const char* source, FILE *out = stderr, unsigned int max_frames = 63)
{
    char linkname[512]; /* /proc/
/exe */
    char buf[512];
    pid_t pid;
    int ret;

    /* Get our PID and build the name of the link in /proc */
    pid = getpid();

    snprintf(linkname, sizeof(linkname), "/proc/%i/exe", pid);

    /* Now read the symbolic link */
    ret = readlink(linkname, buf, 512);
    buf[ret] = 0;

    fprintf(out, "stack trace (%s) for process %s (PID:%d):\n",
        source, buf, pid);

    // storage array for stack trace address data
    void* addrlist[max_frames+1];

    // retrieve current stack addresses
    int addrlen = backtrace(addrlist, sizeof(addrlist) / sizeof(void*));

    if (addrlen == 0) {
        fprintf(out, "  \n");
        return;
    }

    // resolve addresses into strings containing "filename(function+address)",
    // this array must be free()-ed
    char** symbollist = backtrace_symbols(addrlist, addrlen);

    // allocate string which will be filled with the demangled function name
    size_t funcnamesize = 256;
    char* funcname = (char*)malloc(funcnamesize);

    // iterate over the returned symbol lines. skip first two,
    // (addresses of this function and handler)
    for (int i = 2; i < addrlen; i++)
    {
    char *begin_name = 0, *begin_offset = 0, *end_offset = 0;

    // find parentheses and +address offset surrounding the mangled name:
    // ./module(function+0x15c) [0x8048a6d]
    for (char *p = symbollist[i]; *p; ++p)
    {
        if (*p == '(')
        begin_name = p;
        else if (*p == '+')
        begin_offset = p;
        else if (*p == ')' && begin_offset) {
        end_offset = p;
        break;
        }
    }

    if (begin_name && begin_offset && end_offset
        && begin_name < begin_offset)
    {
        *begin_name++ = '\0';
        *begin_offset++ = '\0';
        *end_offset = '\0';

        // mangled name is now in [begin_name, begin_offset) and caller
        // offset in [begin_offset, end_offset). now apply
        // __cxa_demangle():

        int status;
        char* ret = abi::__cxa_demangle(begin_name,
                        funcname, &funcnamesize, &status);
        if (status == 0) {
        funcname = ret; // use possibly realloc()-ed string
        fprintf(out, "  (PID:%d) %s : %s+%s\n",
            pid, symbollist[i], funcname, begin_offset);
        }
        else {
        // demangling failed. Output function name as a C function with
        // no arguments.
        fprintf(out, "  (PID:%d) %s : %s()+%s\n",
            pid, symbollist[i], begin_name, begin_offset);
        }
    }
    else
    {
        // couldn't parse the line? print the whole line.
        fprintf(out, "  (PID:%d) %s: ??\n", pid, symbollist[i]);
    }
    }

    free(funcname);
    free(symbollist);

    fprintf(out, "stack trace END (PID:%d)\n", pid);
}
And finally: some includes to be able to compile the module:
#include <cxxabi.h>
#include <execinfo.h>
#include <execinfo.h>
#include <signal.h>
#include <stdio.h>
#include <stdio.h>
#include <stdlib.h>
#include <stdlib.h>
#include <string.h>
#include <ucontext.h>
#include <unistd.h>
#include <Qt/qapplication.h>
Note that you have to pass some flags during compiling / linking phase in order to have dynamic backtraces available:
-funwind-tables for compiler
- -rdynamic for linker
Fri, 09 Sep 2011 21:07:53 +0000
 My current project I'm working on is based on embedded systems and QT platform. Of course the very first task in the project is to implement some kind of testing method to get feedback on software quality. The test system is composed from few components: My current project I'm working on is based on embedded systems and QT platform. Of course the very first task in the project is to implement some kind of testing method to get feedback on software quality. The test system is composed from few components:
- Automatic crash reports collected on central server
- Automatic random test runners connected to always-running (24/7) devices to catch crashes
First channel collects all crashes (from human and automated tests), second channel is performed fully automatically. Second channel allows to measure MMTF (mean time between failures) and analyse changes in time, probably helping with estimating current software quality state.
Second testing channel requires automatic test driver to inject random UI events (key presses, remote in my case). I used QT message queue for that purpose:
void TestScript::sendKey(int keyCode) {
 QWSServer::sendKeyEvent(0, keyCode, Qt::NoModifier, 1, false);
 msleep(PRESS_DELAY_MS);
 QWSServer::sendKeyEvent(0, keyCode, Qt::NoModifier, 0, false);
 msleep(WAIT_DELAY_MS);
}
Because QWSServer::sendKeyEvent() must be called in the same process like main application I decided to implement named pipe that will accept key names and render sequence of key events, pseudo-code below:
    while (true) {
        FILE* f = fopen("/tmp/events.pipe", "rt");
        (...)
        while (getline(&buf, &size, f) >= 0) {
            QString line(buf);
            (...)
            if (mapNameToKey.contains(line)) {
                sendKey(mapNameToKey.value(line));
                QCoreApplication::processEvents();
            }
            (...)
        }
        fclose(f);
    }
And usage:
echo "RCU_RIGHT" > /tmp/events.pipe
echo "RCU_OK" > /tmp/events.pipe
That's way I'm able to remotely control application (need just SSH access to the device). And the last (easiest) part is to generate random sequence of events - that can be done by any scripting langugae.
Happy automation!
Fri, 28 Oct 2011 22:03:27 +0000

I'm tracking current project state using automated test suite that is executed 24/7. It gives information about stability by randomly exploring project state space. Test launches are based on fresh builds from auto-build system connected to master branch for this project.
Recently I hit few times typical stability regression scenario: N+1th commit that should not have unexpected side effects caused crash in auto-testing suite just after 2 minutes of random testing thus blocking full test suite to be executed. OK, we finally had feedback (from auto-test), but let's compute the (bug .. detection) delay here:
- auto-build phase: 30 minutes .. 1 hour (we build few branches in cycle, sometimes build can wait long time to be performed especially if build cache has to be refilled for some reason)
- test queue wait phase: 30 minutes (pending tests should be finished before loading new version)
- review of testing results (currently manual): ~1 hour (we send automatic reports, but only twice a day)
In worst scenario we may notice the problem (regression) next day! Too long time in my opinion - broken master branch state may block other developers thus slowing down their work. There must be better organization that will allow to react faster on such problems:
- Ask developers to launch random test suite locally before every commit. 5 minute automatic test should eliminate obvious crashes from publishing on shared master branch
- Auto-Notify all developers about every failed test: still need to wait for build/test queue, messages may become ignored after long time
- Employ automatic gate keeper-like mechanism that will promote (merge) commit after some sanity tests are passed
Looks like 1. is more efficient and easiest to implement option. 2. is too "spammy" and 3. is hardest to setup (probably in next project with language with ready support for "commit promotion").
- will look interesting if applied to latest submitters only. Maybe I'll give it a try.
Thu, 15 Mar 2012 23:08:25 +0000
A quite typical picture: software development company X, first delivery of project Y to testing team after few months of coding just failed because software is so buggy and crashes so often. Project Manager decides to invest some money in automated testing tool that will solve all stability problems with click-and-replay interface. Demos are very impressive. The tool was integrated and a bunch of tests were "clicked".
After a month we have 10% of tests that are failing. 10% is not a big deal, we can live with it. After additional month 30% of tests fails because important screen design was changed and some tests cannot authorize themselves in application "for some reason". Pressure for next delivery increases, chances to delegate some testers to fix failing test cases are smaller every week.
What are the final results of above tool?
- unmaintained set of tests (and the tool itself) is abandoned
- man-days lost for setting up test cases
- $$ lost for the tool and training
Has the tool been introduced too late? Maybe wrong tool was selected?
In my opinion automation and integration tests don't play well together. Let's review then main enemies of automation in integration tests:
Initial state setup of environment and system itself
For unit-level tests you can easily control local environment by setting up mocks to isolate other parts of system. If you want test integration issues you have to face with integration-level complexity.
No more simple setups! If you want to setup state properly to get expected result you MUST explicitly set state of whole environment. Sometimes it's just impossible or extremely complicated to set it using UI. If you set states improperly (or just accept existing state as a starting point) you will end with random result changes that will make tests useless (depending on the order of tests or just a state left after previous test run).
Result retrieval after operation
OK, we scheduled action A and want to check if record was updated in DB or not. In order to do that some list view is opened and record is located using search. Then record is opened and we can add expectations to that screen. We cross the UI layer two times: one for update operation, second time for result verification. Are we sure the state has been really preserved in database?
Secondly, if we want to check if "e-mail was sent" (an example of external state change): We cannot see that event in application UI. On the other hand catching on SMTP level will be too unreliable and slow (timings). Without mocks it's hard to deliver fast solution there. And mocks usage mean it's not an E2E test, but some kind of semi-integration test.
It will just not work smoothly.
What's next then?
It's easy to criticize everything without proposing (and implementing) efficient alternatives.
So my vision of integration testing:
- I'm not checking results for automated integration testing, it will just doesn't work cannot be maintained efficiently
- I'm usually generating random input to cover as much functionality as possible using high level interfaces (UI)
- I depend on internal assertions/design by contract to catch problems during such random-based testing, they serve as an oracle (the more the results are better)
- More complicated properties could be specified (and tested) by some temporal logic (this technology is not prepared, yet)
Mon, 09 Apr 2012 21:49:33 +0000
 When you have auto-build and auto-test process already in place you can use the same infrastructure to catch early performance problems as well. It's not as complicated as you may think. When you have auto-build and auto-test process already in place you can use the same infrastructure to catch early performance problems as well. It's not as complicated as you may think.
First of all you can monitor your CPU/IO usage during tests and take snapshots on "errant" situation. If there's no high local processing probably 100% CPU usage means that there are some performance problems in your software. Sample:
top -b -n 1 | awk '
  / 0% idle/ { enable=1 }
  $7 > 20 && $0 && enable { print "kill -SIGUSR2 " $1; }
' | sh
Above script checks for 0% idle time and sends every process that uses above 20% of CPU SIGUSR2 signal. Installed signal handler will make snapshot of current running thread and will give enough information to fix the performance issue.
If your environment doesn't allow to inspect current thread state at any time you can try to guess performance problems source and can introduce special profiling code to catch problems early. For example: typical performance problem is resource over-usage. Resource (remote server, database, ...) may be called very often to retrieve the same data - it's a candidate for local caching.
void ResourceProfiler::count() {
    if (!triggerCount) {
        return;
    }
    counter++;
    if (counter >= triggerCount) {
        time_t deltaS = time(NULL) - timeOfFirstOccurenceS;
        if (deltaS <= intervalS) {
            const int BUFFER_SIZE = 256;
            char buffer[BUFFER_SIZE];
            snprintf(buffer, BUFFER_SIZE, "Abused resource: %s=%d, %s=%ds", ENV_TRIGGER_COUNT, counter, ENV_INTERVAL_S, intervalS);
            warning(buffer);
        }
        timeOfFirstOccurenceS = 0;
        counter = 0;
    } else if (!timeOfFirstOccurenceS) {
        timeOfFirstOccurenceS = time(NULL);
    }
}
Above example shows core method of resource usage profiling code that issues a warning when there are more than triggerCount events in intervalS time frame. You can install this handler by calling count() when given resource is used (served is called, database record is loaded, ...). Over-usage will be located dynamically during auto-tests.
Above method can be generalized to count usage per SQL query to locate very frequent SQL queries (typical N+1 SELECT problem). Instead of use one counter use Map<String, int> for counters and Map<String, time_t> for timestamps. It's left as an exercise for a reader.
Sun, 21 Apr 2013 06:36:09 +0000
My customer develops software for embedded devices using Linux. In the very beginning of this project we faced low stability of builds produced due to complicated nature of platform (C++, manual memory management, new APIs to learn). Of course QA located such bugs, but it was triggered before release on release branches.
In order to support QA and track current state of software stability I added automated random tests feature:

Every build produced by the build system hits testing devices automatically and crash / failed asserts / warnings reports are published to developers (daily, in aggregated form).
We tracked every release branch (assuming it's the most important point for quality measurements). The situation was like on diagram below.

The obvious problem you may notice is related to multiple release branches that must be tested (some support branches live for few months). For every new branch you have to setup new testing device (I decided to attach one device per one tested version). This solution was not scalable and not very easy to maintain.
If we assume that every fix done for release branch (2.0.3 for example) hits at last his master branch (2.0) it's obvious that potential regressions can be tracked automatically using only master branches:
 Benefits are quite obvious: Benefits are quite obvious:
- regression cause detection during normal development (on master branch) is done more accurately - we are able to say that given problem was added new change X on day Y near hour Z - it's visible from automatic tests outcomes (crashes / failed asserts starting from version X)
- less reconfiguration overhead - main development lines are changed less frequently that release branches
- more resources for multi-platform tests: if there's less points in source tree to track we can focus on duplicating hardware for automatic tests - some bugs are hardware-related
Drawbacks:
- we don't track exact released versions: that's true, but we have QA for this purpose (to test final builds)
Fri, 11 Oct 2013 21:06:43 +0000
By searching for already existing implementations of random input-based testing attempts I've located the following material that describes possible level of implementation of that idea using web browser code tests:
Udacity splits possible implementation into the following levels, I've added interpretation in case if there's no browser alone under test, but the server side application:
- verifying only HTTP protocol - HTTP errors 500, 404 will be handled on that level
- HTML level checks - any problems with tags nesting, SGML/XML syntax can be caught there
- rendering - can check any layout-related issue (overlapping divs)
- forms and scripting - checks application logic using client-side language and local state (forms and cookies)
By testing on any of above levels you select application coverage vs level coverage. My idea is to connect random input on all above input levels with validation of every level contracts plus internal contracts check on server. Then we will have the following output:
- caught any HTTP, HTML, rendering (I know it might be hard to automate) and state-related error (not easy to define error here, though)
- collect any assertion, warning, error, crash etc. from server side application with full stacktraces and aggregation
Sun, 22 Dec 2013 13:03:47 +0000
Automated unit tests are hard to write. Software architecture must be designed carefully to allow unit testing. You have to spend time to write tests as well and it's not easy to write good tests. It's easy to make big mess that is hard to maintain after few weeks.
On the other hand automated integration tests are hard to maintain and are fragile. You can "write" them pretty easy in a record-and-replay tool, but later they show their real cost during maintenance.

But there's an answer for problems mentioned above. Do you know Eiffel language? The language has special built-in constructs that support executable contract specification. It's called Design By Contract (DBC). DBC is easier to write and to maintain because no special test cases need to be specified, just conditions for method parameters, expected results and state invariant that must be preserved. How DBC can substitute old-fashioned tests? Read on!
General concepts for DBC are:
- pre-condition: you can specify rules for every input parameter to check contract fulfillment from caller side. If a pre-condition is not met that means there's something wrong with caller
- post-condition: rules for post-method execution state can be specified as well. You can refer to input parameters, current object state and original object state (before method call)
- class invariants: refers to object members and must be valid after every public class call
As an example I'll use DBC implementation called "pycontract" (Python language). It's pretty easy to introduce in a project and uses standard doc-strings (like doctest module). No preprocessing is needed.
Pre-condition is specified by pre keyword:
pre:
    someObject != None and someObject.property > 0
Post-condition syntax uses some special syntax to allow to refer to old values, you have to mention mutable variables object that should be available for state change comparisions:
post[self]:
    self.property = __old__.self.property + 1
Above statement shows that property should be incremented by one after method return.
Invariant syntax is as follows:
inv:
    self.state in [OPEN, CLOSED, SENT]
All above statements must be embedded in method/class comments, here's full example:
class SampleClass:
    """
    inv:
        self.state in [OPEN, CLOSED, SENT]
    """
    def open(self, x):
        """
        pre: x > 0
        post: self.state != CLOSED
        """
DBC assertions (like doc-strings) are disabled by default (they are just comments). You can decide to enable them for example in development builds (there's an overhead related to DBC). An example how to enable pycontract:
import contract
contract.checkmod(modulename1)
contract.checkmod(modulename2)
Example failure (postcondition not met) caught by DBC:
DokumentFiskalny.testDokumentu() Traceback (most recent call last):
  File "test.py", line 164, in
    run_tests()
  File "test.py", line 144, in run_tests
    run_test_module(db, dao, moduleName)
  File "test.py", line 54, in run_test_module
    exec("%s.%s(env)" % (sName, sItem))
  File "", line 1, in
  File "", line 3, in __assert_testDokumentu_chk
  File "lib/contract.py", line 1064, in call_public_function_all
    return _call_all([func], func, va, ka)
  File "lib/contract.py", line 1233, in _call_all
    result = func.__assert_orig(*va, **ka)
  File "/home/darek/public_html/kffirma/DokumentFiskalny.py", line 433, in testDokumentu
    df.zapisz(args)
  File "/home/darek/public_html/kffirma/DokumentFiskalny.py", line 254, in zapisz
    args["idPodmiotuGospodarczego"],
  File "", line 3, in __assert_DokumentFiskalny__create_chk
  File "lib/contract.py", line 1165, in call_private_method_all
    return _method_call_all(getmro(cls), method, va, ka)
  File "lib/contract.py", line 1205, in _method_call_all
    return _call_all(a, func, va, ka)
  File "lib/contract.py", line 1241, in _call_all
    p(old, result, *va, **ka)
  File "", line 3, in __assert_DokumentFiskalny__create_post
  File "/home/darek/public_html/kffirma/DokumentFiskalny.py", line 155, in _create_post
    assert len(result) >= 2
The last part of this puzzle is coverage generation. DBC assertions are evaluated at runtime, so you have to ensure enough percentage code is execute during test runs. Im my experience you can rely on:
- integration-like scenarios (without explicit result verification)
- random input generation
For both cases you can integrate at high, UI level (keyboard, remote controller, HTTP, ...).
Focus on quality techniques is crucial for any software project. If you (1) pay some effort in making your codebase resistant to regressions and (2) maintain that state during project lifetime you can gain more stable software. The real craft lies in selecting proper tools and having enough energy to implement them.
Tue, 07 Jan 2014 22:42:16 +0000
Are you test-infected? Learned already how to grow your server-side apps using unit testing and want to do the same with client (HTML) layer? Search no more! QUnit to the rescue!
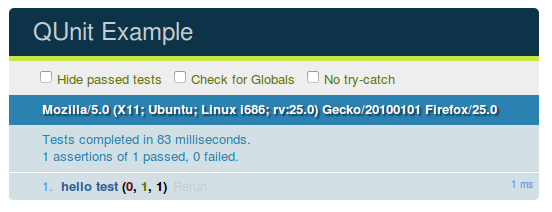
QUnit is a JavaScript library that helps you with tests specification, run and diagnostics. Firstly, you have to include qunit library and your tests in an html file:
<html>
<head>
<link rel="stylesheet" href="/resources/qunit.css">
</head>
<body>
<div id="qunit"></div>
<div id="qunit-fixture"></div>
<script src="/resources/qunit.js"></script>
 <script src="/resources/tests.js"></script>
</body>
</html>
test( "hello test", function() {
ok( 1 == "1", "Passed!" );
});
As you can see:
- syntax for new tests definition is very minimal, just test(name, function)
- qunit is shipped with basic assert like functions: ok(), equal(), ...
- order of predicate and message is better than in JUnit :-)
The next step in QUnit knowledge is to master asynchronous tests. I've seen many nonsense "sleep()" function implementations (hogging CPU power for a loop), properly used setTimeout() is the answer here. asyncTest() helps you with creating such tests that are time-related, an example:
asyncTest("zapChannel() basic test", function() {
    equal(MediaPlayer.zapChannel(2), 0, "0 code means operation succeded")
    // Check after 2s if there's confirmation signal of stream visibility
    setTimeout(function () {
        console.log("zapChannel() - check proper event presence")
        var ev = MediaPlayer.getEvent()
        ok(ev, "event data set")
        start();
    }, 2000)
}
I've bolded important parts:
- asyncTests() starts test that will include asycnhronous parts
- setTimeout() the corrent way for sleep() implementation
- start() tells QUnit to continue, without that test won't finish properly
As you can see if there's an exception inside getEvent() call the start() call won't be called at all. So I've prepared a wrapper for setTimeout() that allows to finish the test and continue properly to the end of test suite:
function delayTest(fn, milliseconds) {
    setTimeout(function () {
        try {
            fn()
        }
        catch (e) {
            msg = e + ": " + e.stack
            console.log(msg)
            ok(0, msg)
        }
        start()
    }, milliseconds)
}
If you use above call instead of setTimeout() your test suite will terminate properly even for exception inside tested method.
And last, but not least: if you want to use ok() call in production code when qunit is not deployed you can use the following workaround:
/* allow ok() assertions even if qunit is not loaded */
if (!isFunction(ok)) {
    function ok(condition, msg) {
        if (!condition) {
            console.log(msg)
            alert(msg)
        }
    }
}
Have a great TDD JavaScript development in new 2014!

|
Tags
|


