Dariusz on Software

Methods and Tools

About This Site

Software development stuff

Archive

Entries tagged "networking".

Sun, 20 Dec 2009 15:20:34 +0000

site-uptime.net, www sited monitoring tool has been just extended with feature to optionally delay notification until problems is confirmed during next (or third) check. It's useful if you encounter with random short network failures and want to skip notification on such short living problems.

1However, such random problems may show efficiency problems with your site (timeouts). You should check carefully what's hidden behind them (web server error log, if available).

Tags: networking.
Sat, 06 Feb 2010 23:00:26 +0000

Próbowałem dziś zalogować się na GL i zauważyłem, że serwis nie działa tak jak powinien (częste "timeouty" w przeglądarce). Postanowiłem przyjrzeć sie bliżej działaniu serwera i założyłem monitor na niego przy użyciu site-uptime.net (interwał 15 minut, metoda: HEAD HTTP/1.0). Oto rezultat po dwóch godzinach monitorowania (ujemna wartość oznacza brak dostępności serwera):

gl

Bardzo ciekawe. Po kolejnej próbie otwarcia strony dostaję następujący komunikat serwowany z url-a: http://www.goldenline.pl/offline.html:

14Przerwa zapewne jest planowa, oczywiście obiecuję trzymać kciuki za obsługę portalu ;-)

Oto co zobaczyłem w środku pliku HTML:

<a href="http://www.goldenline.pl"><img src="logo_big.gif" alt="Praca w GoldenLine" /></a>

Czytaj "mamy problemy ze stabilnością, być może jesteś kompetentnym adminem, żeby nam w tym pomóc, zapraszamy" ;-). W innym:

<!--<strong>GL wraca o 05:00 jeszcze szybszy ;)</strong>-->

Dość duże to okno serwisowe ;-)

UPDATE (2010-02-08): sytuacja została opanowana przed 5-tą jak widać na wykresie:

gl2

Tags: networking.
Wed, 09 Jun 2010 05:11:34 +0000

Flaker to polski serwis mikroblogowy wzorowany na Twitterze. Od kilku dni obserwuję okresową (kilka godzin) niedostępność serwisu. Pojawia się komunikat:

504 Gateway Time-out nginx/0.7.64

Oto wynik monitora realizowanego przez site-uptime.net:

Jak widać serwis boryka się z problemem wydajności podobnie jak kilka miesięcy temu Twitter. Czyżby znowu "popularność zaskoczyła drogowców" ;-) ?

Aktualizacja (2010-06-13). Sytuacja nie wygląda najlepiej. Od tygodnia ciągłe pady i uptime 82%:

Tags: networking.
Tue, 19 Apr 2011 20:48:16 +0000

A typical problem: some work must be done outside the office, but remote services needed are restricted only to office IP address (or some of them are behing VPN). If the service is available under single static port it will be pretty easy to tunnel the connection using SSH.

Tunnel: means you can access the service port as it's available locally. It's not a proxy (however ssh can act as HTTP proxy if configured).

I'll show practical example: Perforce server begind VPN must be accessed outside office. First, configure it using ~/.ssh/config (more elegant solution):

Host dccf
     User user1
     HostName 123.123.123.123
     Port 10222
     LocalForward 1333 124.124.124.124:1666

123.123.123.123 is a public office IP, 124.124.124.124 is IP of the service (that operates on 1666 port). Then you can connect new alias:

$ ssh dccf -N &

After this operation you can connect the service using local address (localhost) with local port (1333 in this example):

$ export P4PORT=127.0.0.1:1333
$ p4 sync ...

Option "-N" is useful when you want to only forward some ports. Of course you can setup the tunnel from command line as well in one step:

$ ssh dccf -N -L 1333:124.124.124.124:1666 123.123.123.123

Enjoy!

Tags: networking.
Tue, 26 Jul 2011 21:55:37 +0000

Collecting runtime errors (crashes, failed assertions, ...) is very important part of software quality efforts. If you know crash details from your testing team you can handle them even before a tester writes first line of error report (!). That improves development speed.

Probably the fastest method how to create KISS (Keep It Simple Stupid) central crash report repository is to use:

  • netcat - command line UDP server
  • crontab - for daily logs rotation

Let's see the crontab entry:

0 0 * * *    killall -9 -q netcat; while true; do echo "A"; sleep 0.1; done | netcat -v -k -u -l 4000 \
    >> crash/crash-`date +%Y%m%d`.log 2>&1 &

/dev/zero as input needed for some reason (otherwise process will exit after first crash report). "date"/"kill" allows to split crash reports per day. "-l 4000" is the port definition, "-u" tells netcat to use UDP instead of TCP (the default).

Crash handlers inside tested programs must open UDP connection to above server and send textual representation of stacktrace (should be available in rutime via reflection).

And sample result from log file (C++, but one may consider Java/Python as implementation language):

Connection from 192.168.4.168 port 4000 [udp/*] accepted
stack trace (libstacktrace init) for process /bin/busybox (PID:1342, VER=master:0f9cc45:vip1963):
  (PID:1342) /usr/local/lib/libbacktrace.so : install_handler()+0x198
  (PID:1342) /usr/local/lib/libbacktrace.so [0x29589e78]: ??
  (PID:1342) /usr/local/lib/libbacktrace.so [0x2958db6a]: ??
stack trace END (PID:1342)
Tags: linux, networking.
Fri, 16 Sep 2011 22:52:07 +0000

Current project I'm working on benefits from automated test suite run on few Linux-based devices. Tests are running 24x7, but sometimes device hangs (reason is still under investigation) and SSH access is blocked then.

In order to track the problem I redirected syslog (busybox-based, BTW) via network and added local automatic monitoring service that will show me when a part of my test installation go down.

The script is really simple and uses GNOME notification tool called notify-send.

#!/bin/sh
if ! ping -q -c 1 google.com > /dev/null
then
    # no network present
    exit
fi
for machine
do
    F=/tmp/$machine
    F2=/tmp/$machine.previous

    if ssh $machine 'echo OK' >$F 2>&1
    then
        rm -f $F $F2
    else
        if test -f $F2
        then
            notify-send "$machine is not present: `cat $F`"
        fi
        mv $F $F2
    fi
done

Details:

  • I'm checking if network is available in general (google ping)
  • List of SSH machines given on command line
  • I assume SSH keys are setup - no password prompt
  • Check state is held in /tmp/ directory

Script is started periodically from crontab:

* 9-17 * * 1-5    srv-monitor-ssh alfa beta delta zeus zeus2

and reports failure on second failed check.

Mon, 17 Dec 2012 09:05:14 +0000

I do prefer small command line utilities over heavy GUI tools and use then whenever possible. Command line has better post-processing possibilities (you can pipe output to other tools) and automation (you can easily script them). Small example of network scan below.

For example sometimes you want to analyze DHCP requests details but without overhead needed by Wireshark (you may work over SSH without GUI). Then it's very easy using some useful command line tool. Recently I needed to check "Vendor class identifier" field sent from device with given MAC address: (1C:C6:3C:74:B9:47 in our case). It's very easy:

$ sudo dhcpdump -i eth0 -h 1C:C6:3C:74:B9:47 | grep 'Vendor class identifier'
OPTION:  60 ( 25) Vendor class identifier   ABC8776

"eth0" was my local device used for sniffing network packers.

As you can see it was very easy (and much faster that typical Wireshark use).

Tags: networking.
Mon, 28 Jan 2013 09:43:48 +0000

If you want to track network problems with IPTV streaming you may take a look at IGMP messages exchange in your network. IGMP is used to register clients for multicast streaming. You may record whole stream using Wireshark of course, but there's much lightweight solution:

$ sudo tcpdump -i eth0 igmp
tcpdump: verbose output suppressed, use -v or -vv for full protocol decode
listening on eth0, link-type EN10MB (Ethernet), capture size 65535 bytes
10:33:44.193733 IP 192.168.4.168 > all-routers.mcast.net: igmp leave 224.0.252.93
10:33:44.205985 IP 192.168.4.168 > 238.2.2.6: igmp v2 report 238.2.2.6
10:33:44.304046 IP 192.168.4.168 > 238.2.2.6: igmp v2 report 238.2.2.6
10:33:44.325005 IP 192.168.4.168 > 238.2.2.6: igmp v2 report 238.2.2.6
10:33:44.975081 IP 192.168.4.214 > all-routers.mcast.net: igmp leave 238.1.2.4
10:33:44.989943 IP 192.168.4.214 > 238.2.2.6: igmp v2 report 238.2.2.6
10:33:45.049022 IP 192.168.4.237 > all-routers.mcast.net: igmp leave 238.1.2.5
10:33:45.369314 IP 192.168.4.237 > 238.2.2.6: igmp v2 report 238.2.2.6
10:33:45.389416 IP 192.168.4.237 > 238.2.2.6: igmp v2 report 238.2.2.6
10:33:45.435321 IP 192.168.4.237 > 238.2.2.6: igmp v2 report 238.2.2.6
10:33:45.789133 IP 192.168.4.168 > 238.1.2.7: igmp v2 report 238.1.2.7
10:33:45.882137 IP 192.168.4.168 > 238.1.2.7: igmp v2 report 238.1.2.7
10:33:45.905140 IP 192.168.4.168 > 238.1.2.7: igmp v2 report 238.1.2.7

Tcpdump is a command line tool that shows all network traffic to stdout (filtered to IGMP protocol in our case) you can filter later by grep and do detailed analysis and statistics.

Tags: networking.
Wed, 10 Apr 2013 08:04:12 +0000

Sometimes you are interested if the software issues proper HTTP requests to the server. You have three options here:

  1. checking client logs and assume all HTTP requests are reported
  2. checking server logs to see what have been issued
  3. using tcpdump for traffic monitoring

I'll show you 3rd method - it's useful if you don't have access to server nor to client logs.

$ sudo tcpdump -s 1024 -l -A dst 192.168.3.120 -i eth0 | grep HTTP
..Hp.c..GET /url/path?param1=value1&OpCode=add&ChannelID=101434 HTTP/1.1
.....c.*GET /url/path?param2=value2&OpCode=add&ChannelID=101434 HTTP/1.1

192.168.3.120 is the server IP address.

Pretty simple and more elegant solution than using full wireshark (and you can use it having only console access).

Tags: networking.
Wed, 01 May 2013 11:33:09 +0000

Wireshark is a tool that allows to scan network packets and make analysis of network connection without direct access to server or client. Today we will show simple method to analyse TCP connections using this tool.

TCP connection is composed of many IP packets, connected by common strem index number. You can select particular TCP stream using Analyze / Follow TCP stream option or directly select given stream by it's index: tcp.stream eq 9 If you want track every opened connection you can check 1st packet of every TCP stream opened to particular server IP (213.75.34.114 in our example): tcp.flags.syn==1 and tcp.flags.ack==0 and ip.dst == 213.75.34.114 Note that with HTTP/1.1 things may be more complicated as this protocol supports "Persistent/Keep Alive" mode that allows multiple requests over one connection, so you may see only one packet with "tcp.flags.syn==1 and tcp.flags.ack==0". In order to scan full exchange you have to analyse protocol contents for request / response pairs.

Another complication is HTTPS (HTTP over SSL layer) - you won't be able even to count requests (if using "Keep Alive" mode). In this scenario you have to check traffic after HTTPS node or just inspect server logs.

Tags: networking, ssl.
Sat, 08 Feb 2014 20:43:09 +0000

logo_sslSSL is used for (1) encrypting HTTP traffic and for (2) authentication server against browser's database of trusted certificates. Generating SSL certificate properly is important if you want your customer to use https properly. It costs few bugs per year, but your customers won't have any warnings in browser before SSL session (purpose number 2).

However, for internal applications, self-signed certificate may be a sufficient solution (purpose 1 only). You will find below a minimal commands to generate local SSL certificate (accept default values when asked for data on stdin): mkdir -p /etc/lighttpd/ssl/local cd /etc/lighttpd/ssl/local openssl genrsa -passout pass:1234 -des3 -out server.key 1024 openssl req -passin pass:1234 -new -key server.key -out server.csr cp server.key server.key.org openssl rsa -passin pass:1234 -in server.key.org -out server.key openssl x509 -req -in server.csr -signkey server.key -out server.crt cat server.key server.crt > server.pem Then lighttpd installation: $SERVER["socket"] == "<YOUR_IP_ADDRESS>:443" { ssl.engine = "enable" ssl.pemfile = "/etc/lighttpd/ssl/local/server.pem" ssl.ca-file = "/etc/lighttpd/ssl/local/server.crt" } Then you have to accept server certificate in your browser and voila!

Tags: httpd, networking, ssl, web.
Wed, 16 Apr 2014 06:29:59 +0000

The old truth that everyone who spends days on business trips: hotels generally suck at local Internet delivery service. The least important service in hotel is pretty crucial if you depend on it to finish some work after business hours.

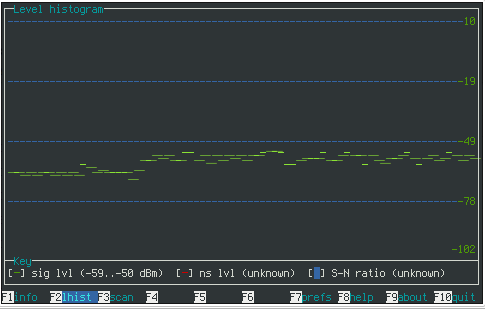
However, if you are on Linux/Ubuntu machine there's a nice tool that will allow you to evaluate WIFI signal quality. It's name is: wavemon. It's a console tool that shows current (and previous) signal strength.

335

Having real-time measurement you can decide what area of the hotel have the best signal strength.

Tags: networking.
Sat, 03 Jan 2015 09:44:16 +0000

If you encounter the following error during VPN connection: pptp[12549]: nm-pptp-service-12543 warn[decaps_gre:pptp_gre.c:331]: short read (-1): Message too long there's an easy fix. You have to lower your MTU (automatically obtained value was invalid).

First, you have to locate your VPN gateway address in syslog: NetworkManager[11926]: <info> VPN Gateway: X.X.X.X Then, you have to check minimum MTU toward this address: $ traceroute --mtu X.X.X.X traceroute to X.X.X.X (X.X.X.X), 30 hops max, 65000 byte packets 1 192.168.43.1 (192.168.43.1) 4.309 ms F=1380 4.042 ms 2.535 ms 2 * *^C Then you have to change MTU it in your primary connection settings (network manager on Ubuntu below):

504

That's all!. No more spurious disconnects!

Tags: networking.
Thu, 12 Nov 2015 15:57:01 +0000

cable-ethernetIn order to locate conflicting DHCP server in your LAN execute the following command:

sudo dhcpdump -i eth4 | awk '/IP:/{SRC=$2 " " $3} /OP:.*BOOTPREPLY/{ print "DHCP server found:", SRC; }'

The restart your PC network (use DHCP to get new IP). If you see more than one IP address here:

DHCP server found: 192.168.4.1 (0:9:6b:a3:fc:4a) DHCP server found: 192.168.1.1 (f8:d1:11:9e:1d:8b) DHCP server found: 192.168.4.1 (0:9:6b:a3:fc:4a) DHCP server found: 192.168.1.1 (f8:d1:11:9e:1d:8b) DHCP server found: 192.168.4.1 (0:9:6b:a3:fc:4a)

Then you have two, conflicting DHCP servers in your network. You can use http://www.coffer.com/mac_find/ tool to locate the device type that causes the problems.

Tags: linux, networking.

RSS feed

Tags

Created by Chronicle v3.5